Download presentation
Presentation is loading. Please wait.

1
Denton ISD’s EXPO Task Force

2
Denton ISD & of Ethnicity Population Served in GT

5
CaucasianHispanicAfrican American AsianAmerican Indian Pacific Islander 2 or more racesTotal Elementary 5241393140305742 Middle School 4191554930418666 High School 50596163510116679 EXPO K-12 Total 144839096105172292087 Total number of EXPO students for 2010-2011

6
CaucasianHispanicAfrican American Asian/Pacific Islander Native American Total 2006 - 2007 146130911494211999 2007 - 2008 1459303106112222002 2008 - 2009 1413313102125181971 2009 - 2010 1558358103125162160 EXPO students per year comparing this year to last year CaucasianHispanic African American Asian/Pacific Islander Native American 2 or more races Total 2009 – 2010 1558358103125162160 2010 – 2011 14483909610717292087 + or --110+32-5-18+1NA-73 Total number of EXPO students per year

7
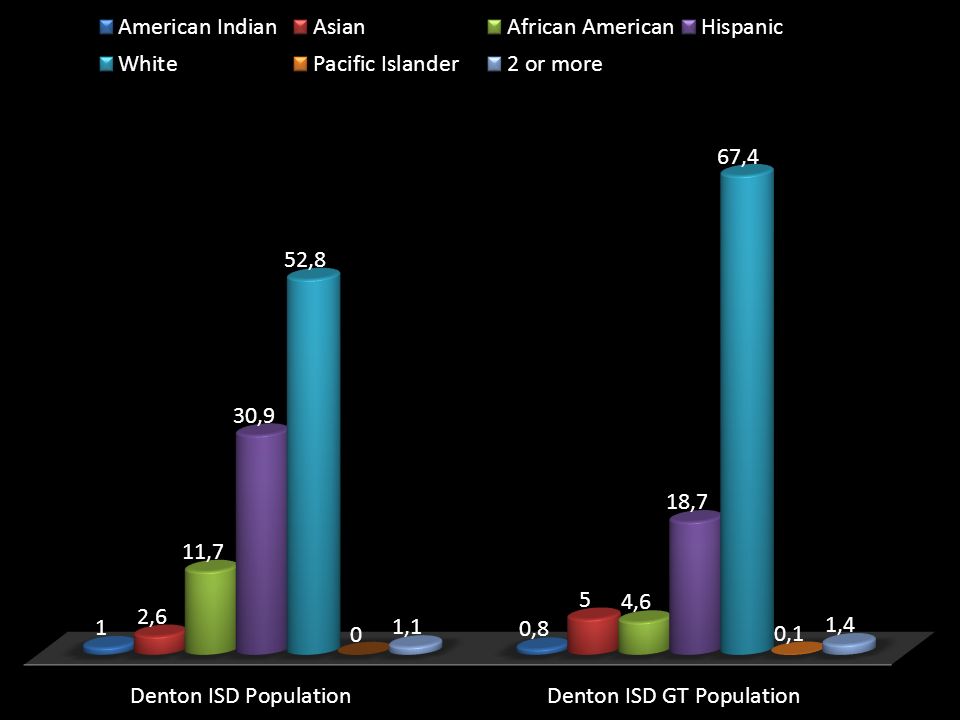
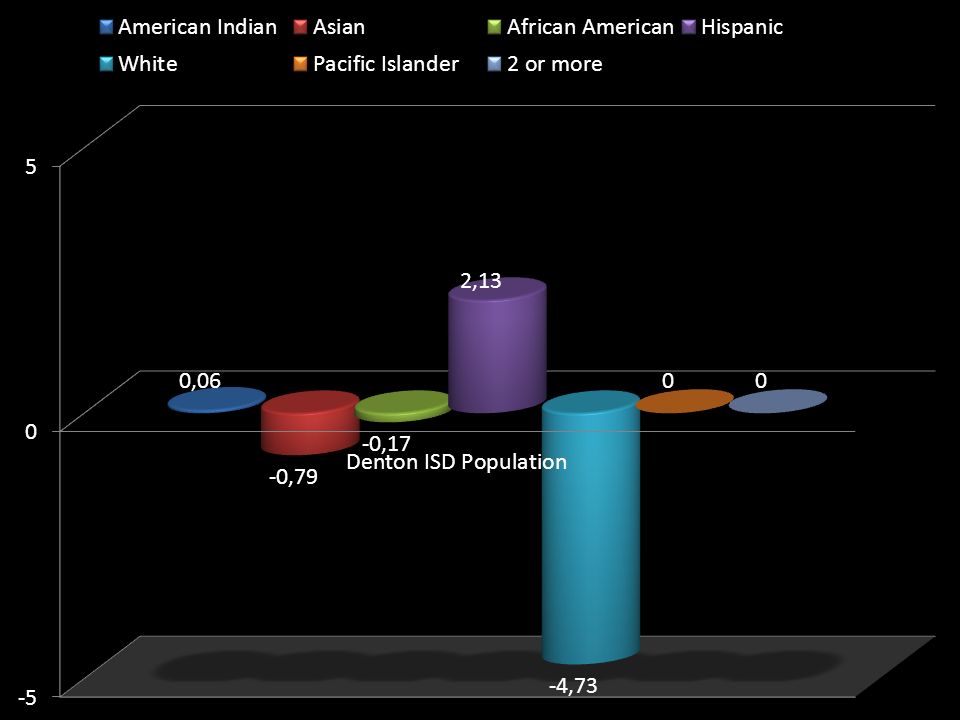
CaucasianHispanicAfrican American AsianAmerican Indian Pacific Islander 2 or more races GT students 67.4%18.7%4.6%5.0%0.8%0.1%1.4% District students 52.8%30.9%11.7%2.6%1.0%0.0%1.1% + or – (GT to District) +14.6-12.2-7.1+2.4-0.2+0.1+0.3 Percentage of EXPO students for 2010-2011
 Percentage of EXPO students for")
8
Our next meetings : Monday, Jan. 31 st Monday, Feb. 7 th all 4:00 Monday, Feb. 14 th to 5:00 Monday, Feb. 21 st Monday, Feb. 28 th Monday, March 7 th

9
http://www.gtequity.org/docs/equity_in_ge.pdf

Similar presentations


>")


