Download presentation
Presentation is loading. Please wait.

1
Elizabeth Traver University of Wyoming Quantifying spatial patterns in time of transpiration in aspen, alder, and sugar maple dominated forests

2
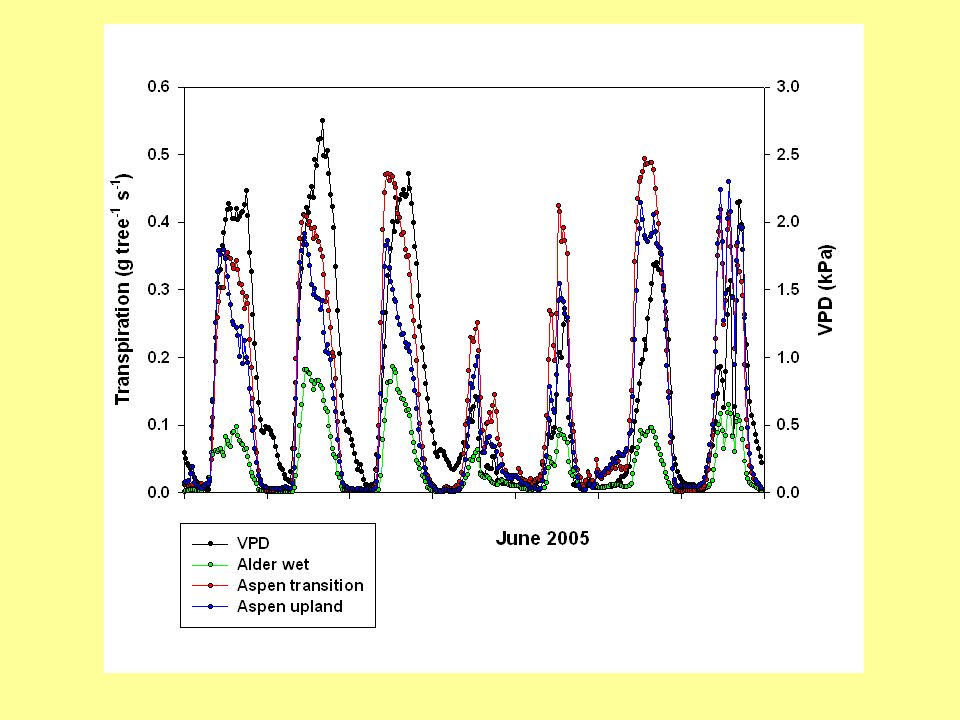
Why spatial transpiration? There is solid evidence that VPD is a major driver of transpiration in time, but it does not explain the variable spatial patterns within species. Stands of trees tend to be more heterogeneous than homogeneous, with significant boundary areas--what causes these spatial patterns? Finding the--possibly edaphic—causes of these spatial patterns, we can use that knowledge to scale up to larger, heterogeneous landscapes.

3
Hypotheses VPD explains the temporal variability in spatial autocorrelation of transpiration. At high VPD, edaphic conditions will explain the spatial autocorrelation of variability in transpiration total N impacts on root properties soil texture impacts on root cavitation

4
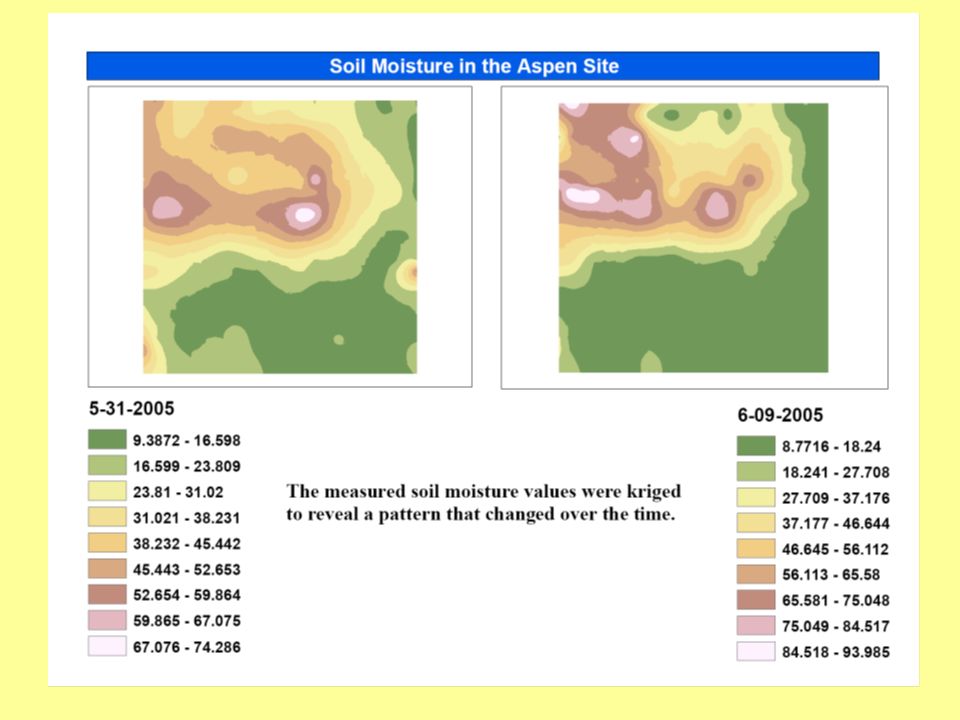
Sites Aspen—Alder: SE of the WLEF tower –120 m by 120 m with 144 plots in a 3/7 cyclic design –Runs from wetlands in NW to dry upland in SE Sugar Maple—Red Pine: NW of the WLEF tower –120 m by 120 m with 144 plots in a 3/7 cyclic design –Mostly sugar maple crossed by swath of red pine

5
Aspen-Alder site Sugar Maple-Red Pine site WLEF Tower

6
3/7 Cyclic sampling design.

7
Methods Measure sap flux spatially -- Granier: constant heat flux sensors Measure or acquire environmental factors -- micrometeorology from WLEF tower: μ, Q, rh, temp Measure soil characteristics within the 3/7 cyclic plots already established –Soil moisture curves –Soil texture –Total N Intra-tree scaling -- A sap Spatial sampling/analysis -- cyclic, ‘variograms, geostatistics, GIS

8
Various measurements and instruments in action

10
Ewers et al. 2006 Ag For Met

13
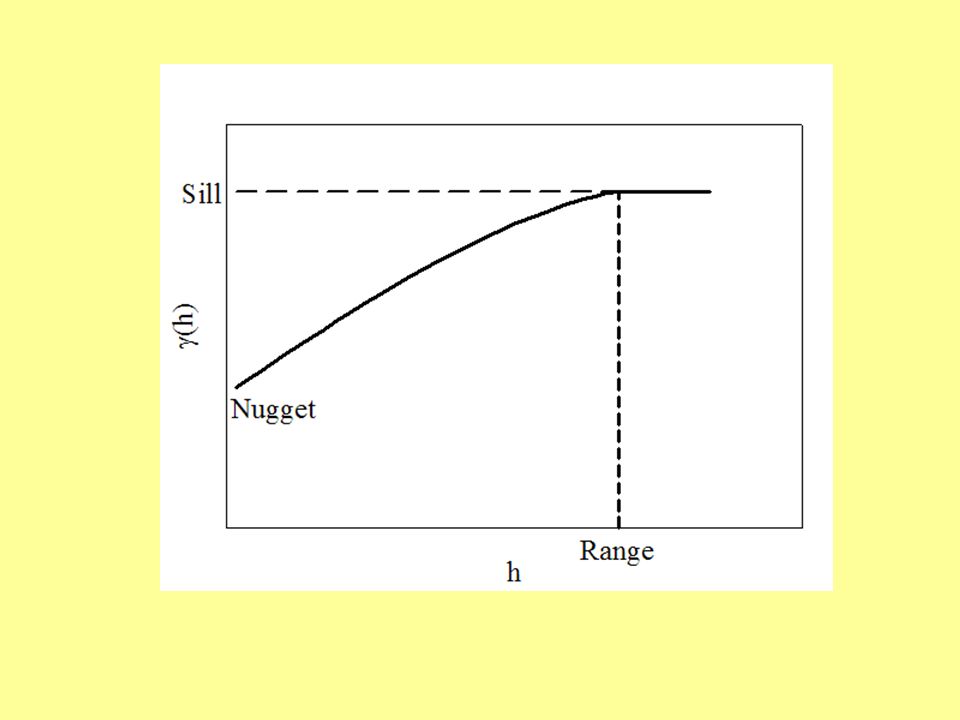
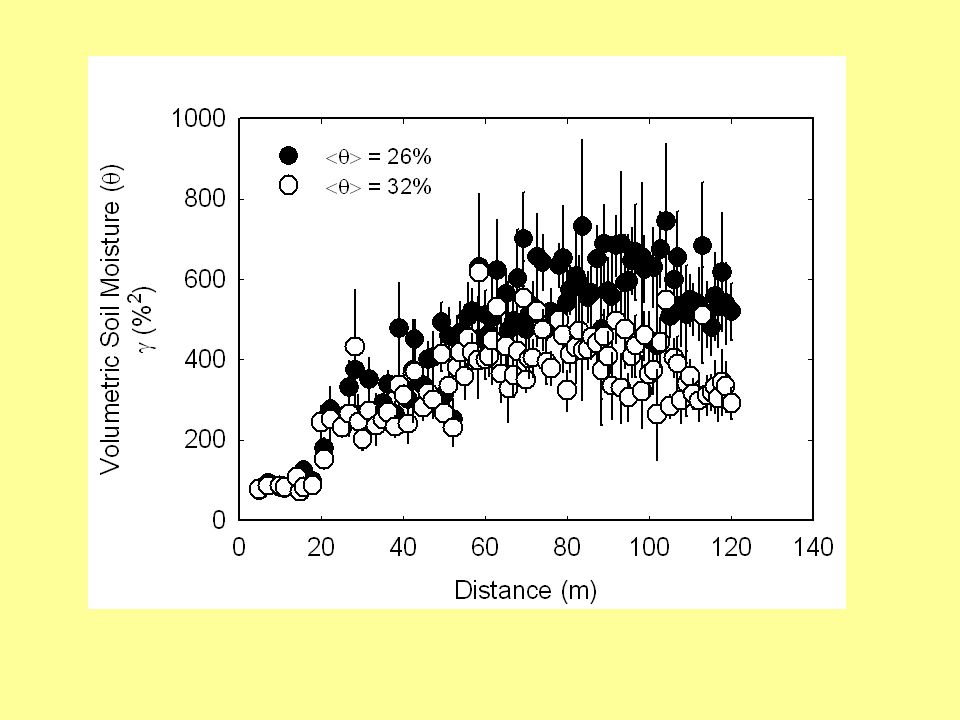
Nugget, sill, and range of transpiration plotted against VPD. As transpiration variation increases with VPD, spatial autocorrelation decreases. (Data from the aspen- alder stand.)
.")
16
Future work Using what is already known about the temporal variability of transpiration, look at edaphic conditions to explain the spatial variability.

Similar presentations


 AND REMOTE SENSING Lecture 4 Zakaria Khamis.>")


 Dr. John Stella Anna Harrison.>")


 School of Natural Resources & Environment McIntire-Stennis Cooperative Research October.>")


