Download presentation
Presentation is loading. Please wait.

1
Using Minitab to construct Control Chart Part 2

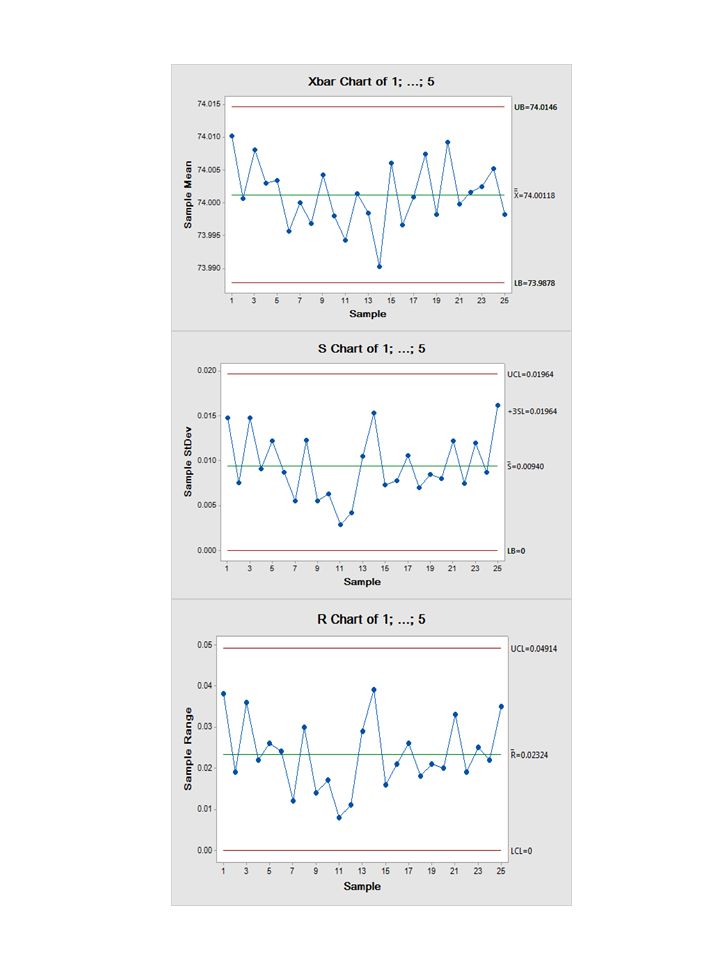
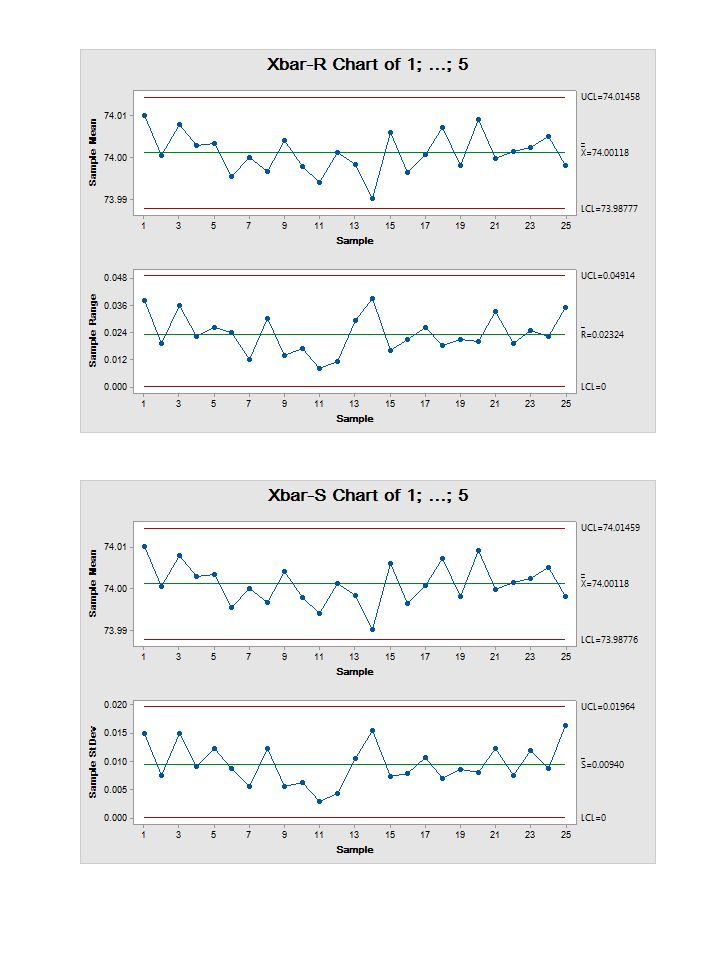
2
SN12345 174.03074.00274.01973.99274.008 273.99573.99274.00174.01174.004 373.98874.02474.02174.00574.002 474.00273.99673.99374.01574.009 573.99274.00774.01573.98974.014 674.00973.99473.99773.98573.993 773.99574.00673.99474.00074.005 873.98574.00373.99374.01573.988 974.00873.99574.00974.00574.004 1073.99874.00073.99074.00773.995 1173.99473.99873.99473.99573.990 1274.00474.00074.00774.00073.996 1373.98374.00273.99873.99774.012 1474.00673.96773.99474.00073.984 1574.01274.01473.99873.99974.007 1674.00073.98474.00573.99873.996 1773.99474.01273.98674.00574.007 1874.00674.01074.01874.00374.000 1973.98474.00274.00374.00573.997 2074.00074.01074.01374.02074.003 2173.98274.00174.01574.00573.996 2274.00473.99973.99074.00674.009 2374.01073.98973.99074.00974.014 2474.01574.00873.99374.00074.010 2573.98273.98473.99574.01774.013

5
Attribute Control Chart Attribute control charts are the charts that plot nonconformities (defects) or nonconforming units (defectives). A nonconformity refers to a quality characteristic and a nonconforming unit refers to the overall product. A unit may have many nonconformities, but the unit itself is either conforming or nonconforming. For example, a scratch on a metal panel is a nonconformity. If several scratches exist, the entire panel may be considered nonconforming. In fact, control charts for attributes are used to measure quality characteristics that are counted rather than measured. Attributes are discrete in nature and entail simple yes-or-no decisions. For example, this could be the number of nonfunctioning lightbulbs, the proportion of broken eggs in a carton, the number of rotten apples, the number of scratches on a tile, or the number of complaints issued.

6
Types of control charts for attributes Two of the most common types of control charts for attributes are p-charts and c-charts. P-charts are used to measure the proportion of items in a sample that are defective. Examples are the proportion of broken cookies in a batch and the proportion of cars produced with a misaligned fender. P-charts are appropriate when both the number of defectives measured and the size of the total sample can be counted. A proportion can then be computed and used as the statistic of measurement. C-charts count the actual number of defects. For example, we can count the number of complaints from customers in a month, the number of bacteria on a petri dish, or the number of barnacles on the bottom of a boat. However, we cannot compute the proportion of complaints from customers, the proportion of bacteria on a petri dish, or the proportion of barnacles on the bottom of a boat. The primary difference between using a p-chart and a c-chart is as follows. A p-chart is used when both the total sample size and the number of defects can be computed. A c-chart is used when we can compute only the number of defects but cannot compute the proportion that is defective.

7
The sample standard deviation is computed as follows: where n is the sample size.

8
Example: A production manager at a tire manufacturing plant has inspected the number of defective tires in twenty random samples with twenty observations each. Following are the number of defective tires found in each sample: Construct a three-sigma control chart (z = 3) with this information No.defects 132 31 42 51 63 73 82 91 102 113 122 132 141 151 162 174 183 191 201 sample 20
 with this information No.defects sample 20.")
9
The center line of the chart is In this example the lower control limit is negative, which sometimes occurs because the computation is an approximation of the binomial distribution. When this occurs, the LCL is rounded up to zero because we cannot have a negative control limit.

10
np The np Control Chart. It is also possible to base a control chart on the number nonconforming rather than the fraction nonconforming. This is often called an number nonconforming (np) control chart. The parameters of this chart are as follows.
 control chart. The parameters of this chart are as follows..")
Similar presentations


>")


. Peta Kontrol ( data atribute ) Attribute control charts arise when items are compared with some standard and then are.>")


