Download presentation
Presentation is loading. Please wait.

1
Web-based Data and Mapping Tools IHWC 2011 Visualizing Data for Impact

2
Pictures make clear

3
Maps are pictures that give context to data Earth at Night, 2006

4
Map Breakthroughs create revolutions The Mercator projection is a cylindrical map projection presented by the Flemish geographer and cartographer Gerhard Kramer (Gerardus Mercator), in 1569. It became the standard map projection for nautical purposes because of its ability to represent lines of constant course—it permitted circumnavigationGerardus Mercator

5
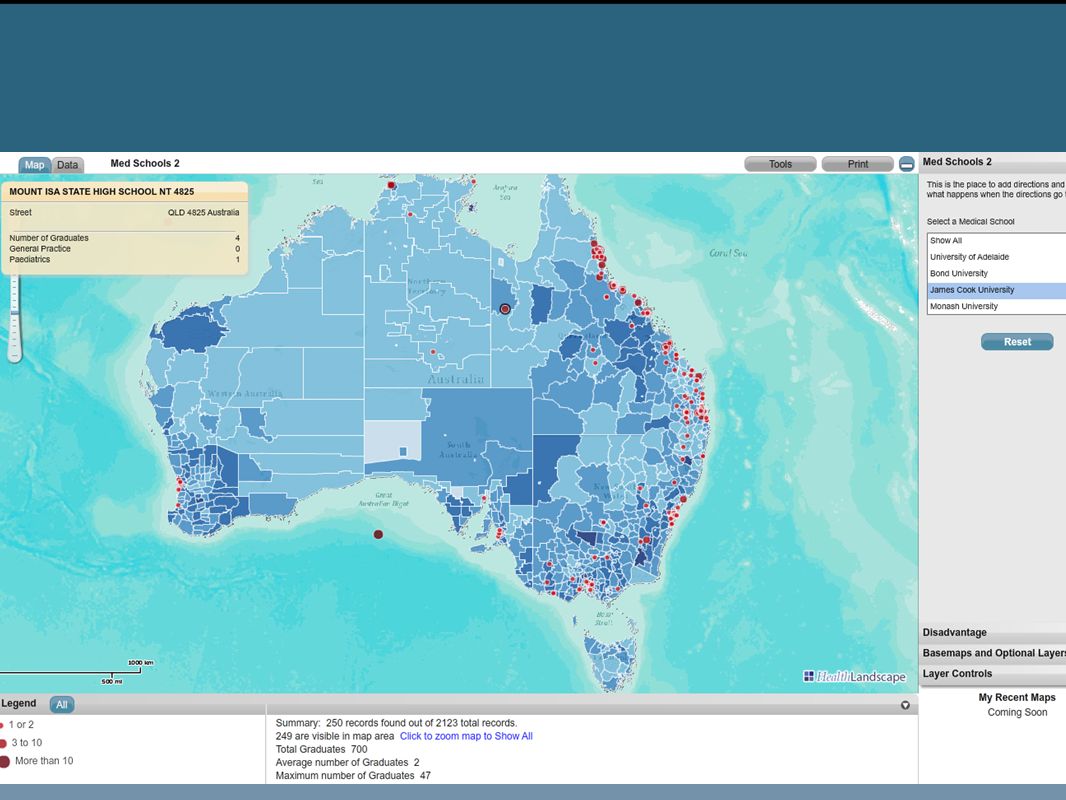
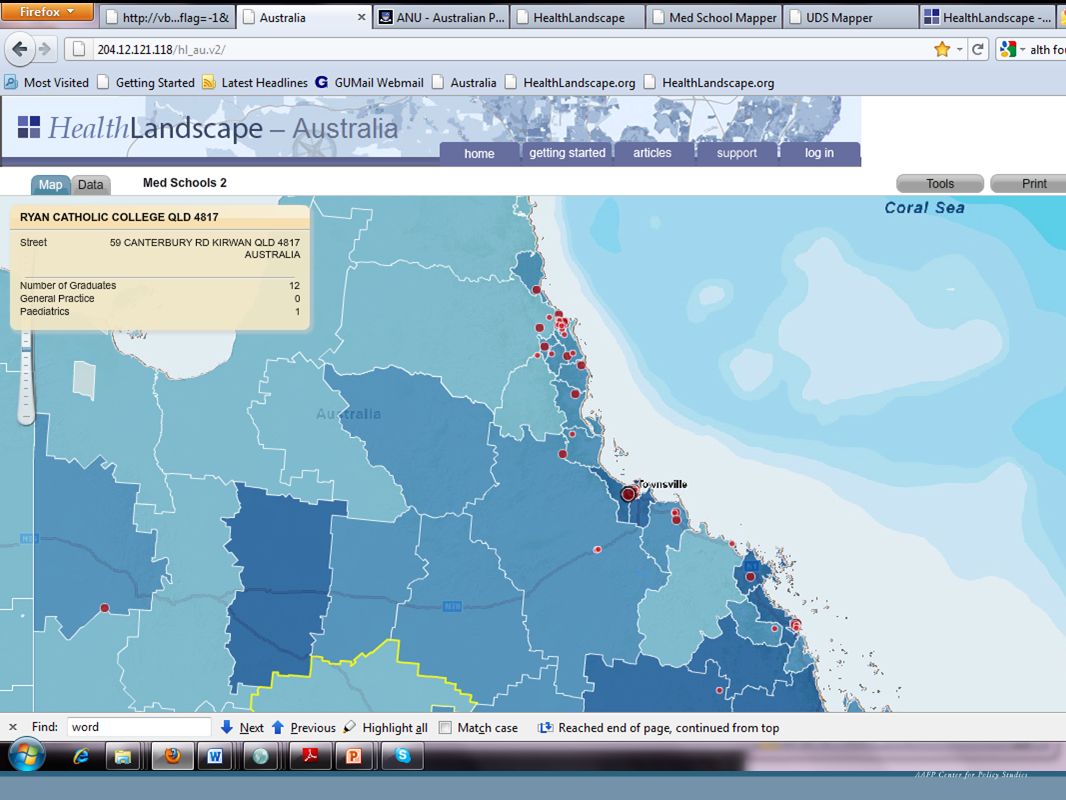
History Population Access Assessment Community Health Center Service Areas Social Determinants of Health Allocation of scarce resources APHCRI-Graham Center Fellowship and interest in GIS

6
Assigned to Serve Actually Serving Boone County Family Health Center, 1998

7
Poor Access To Care by Census Tract, 1998 Vs. FHC Service Area Phillips R, et al. Using Geographic Information Systems to understand health care access. Archives of Family Medicine. 2000;9(10).
..")
8
Baltimore Medical Systems, 2002 Largest FQHC in Baltimore Very curious about patient patterns and targeting prevention

9
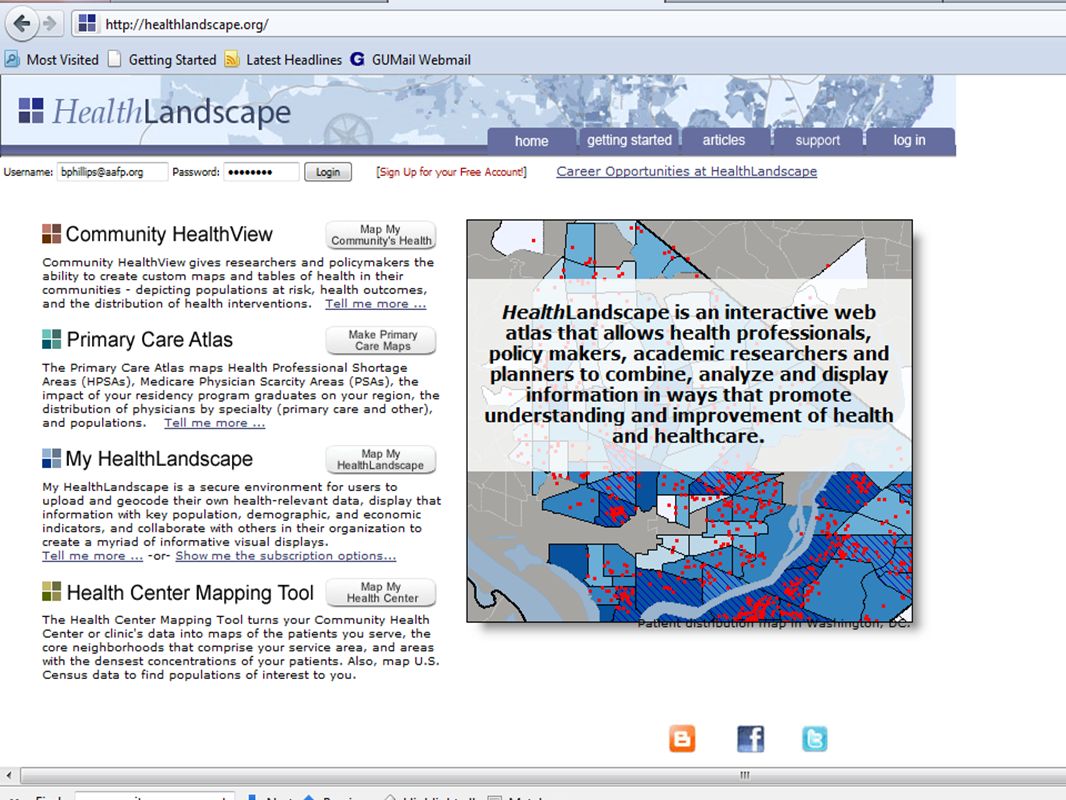
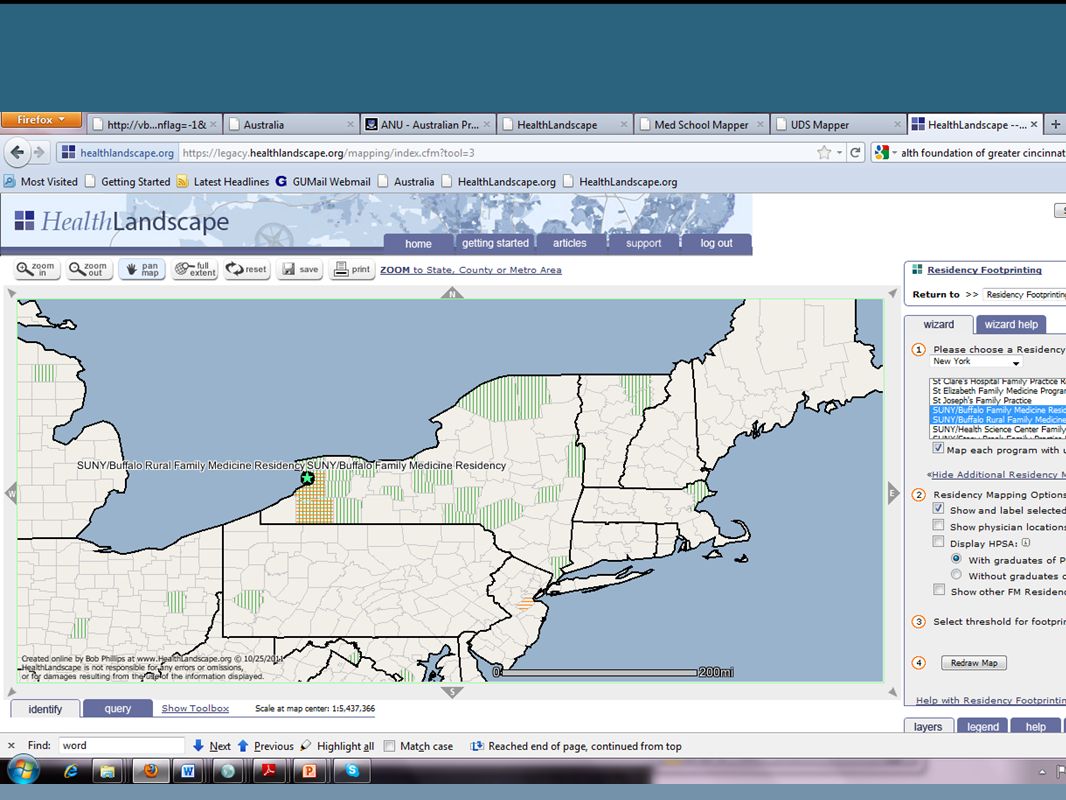
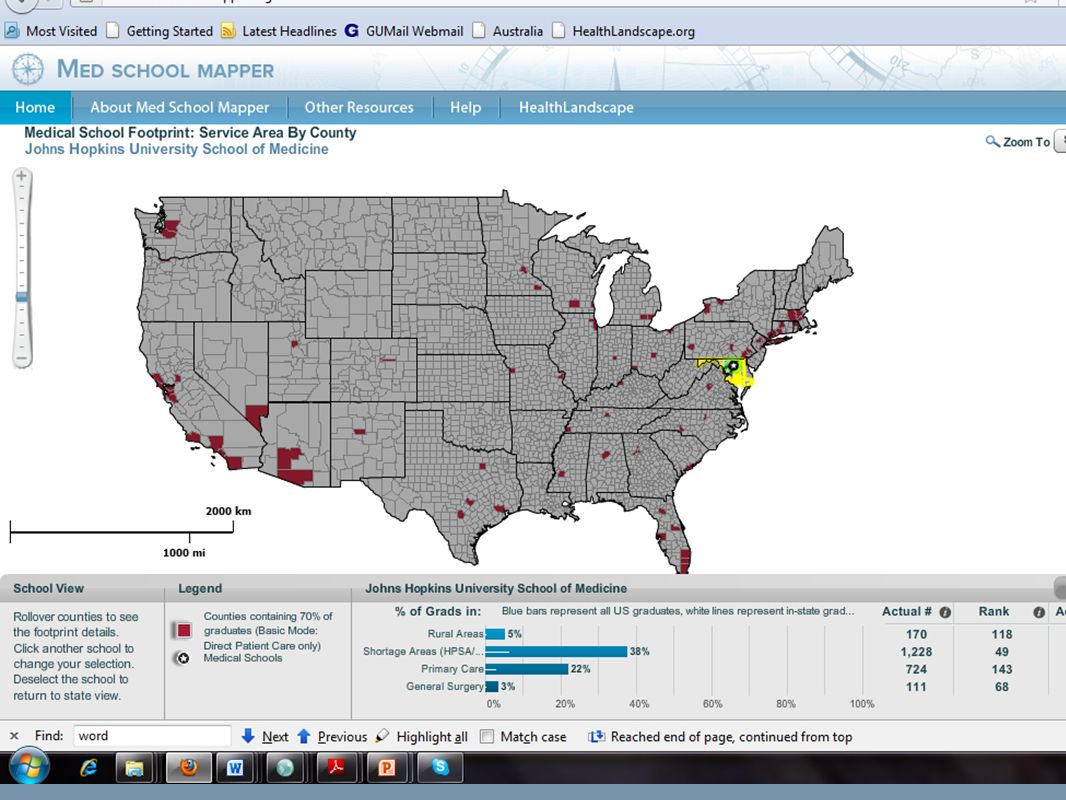
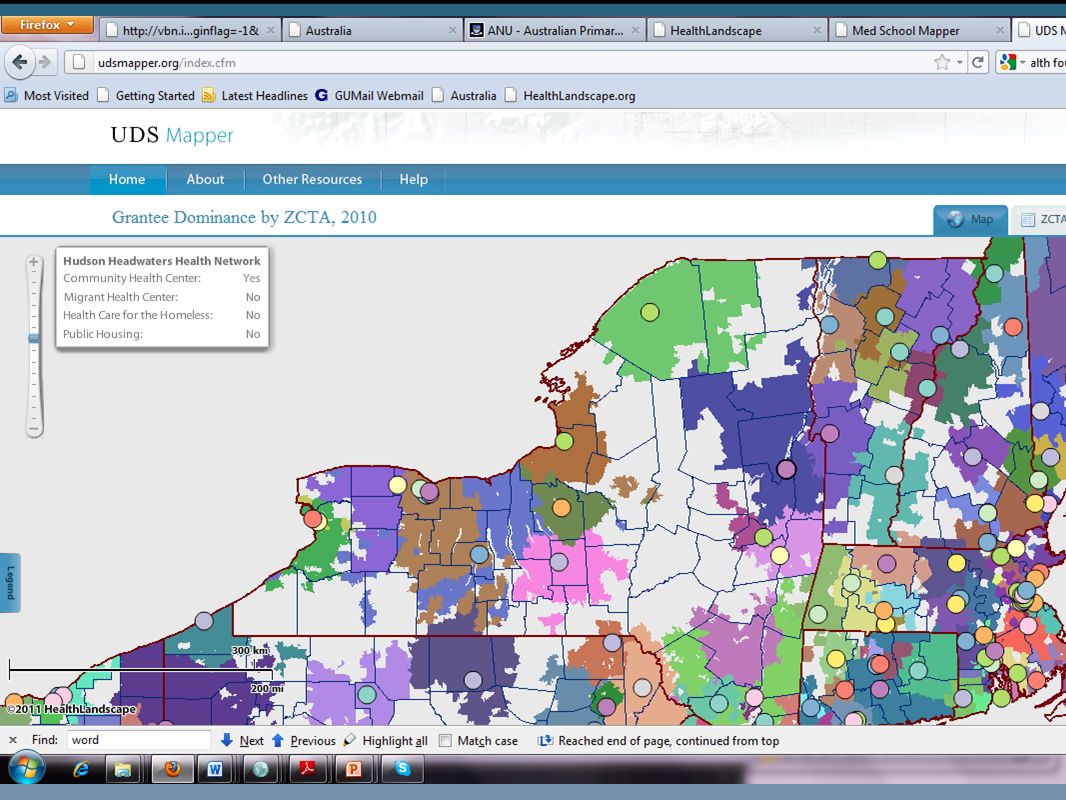
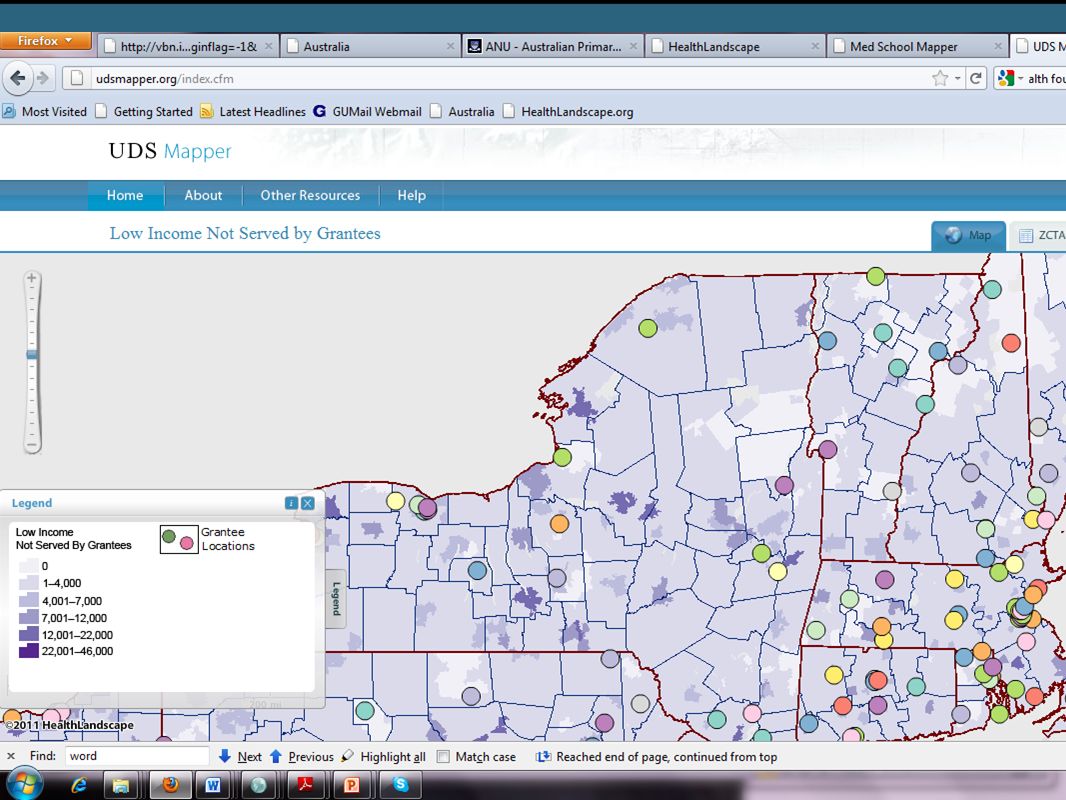
http://archive.ahrq. gov/data/safetynet/ phillips.htm Mapping Tools for Monitoring the Safety Net AHRQ publication

10
Purpose Data Democratization – Information Liberacion Common space for visualizing data –Sharing data –Interacting data –Extracting information –Assigning accountability More effective and efficient interventions (and evaluation)
")
11
Partnerships Bob Wells Danielle Butler (Lead) Ian McCrae Pau Konnings
 Ian McCrae Pau Konnings")
17
2011 Best Web-Based Application ESRI International Users Conference UDS Mapper

25
APCHRI Cooperative Research Center in Geospatial Analysis Mr Robert Wells Dr Bob Philips Dr Andrew Bazemore Mr Adam Catchpole Mr Tom Mueller Professor John Humphreys Dr Mathew McGrail Dr Simon French Dr Paul Grinzi Dr Peter Del Fante Mr Don Allan Dr Lucio Naccarella Ms Sharon Kosmina Ms Claire Austin Associate Professor Ellen McIntyre Dr Rod Whiteley Professor James Semmens Ms Narelle Mullan Mr Paul Macdonald Dr Ross Noble Professor Justin Beilby Associate Professor John Glover

Similar presentations