Download presentation
Presentation is loading. Please wait.

1
Chapter 12 Sample Surveys math2200

2
How to generalize beyond the data? Three ideas Examine a part of the whole Randomize Sample size

3
Idea 1 Population –Who we would like to know about –Impractical to examine the entire population Sample –A group of individuals selected from the population –A properly selected sample can represent the population –Example: taste a small part of what you’re cooking to get an idea about the dish as a whole.

4
Opinion polls Example of Sample surveys. Designed to ask questions of a small group of people in the hope of learning something about the entire population. –Professional pollsters work quite hard to ensure that the sample they take is representative of the population. –If not, the sample can give misleading information about the population.

5
Bias Sampling methods that, by their nature, tend to over- or under- emphasize some characteristics of the population are said to be biased. –Bias is the bane of sampling—the one thing above all to avoid. –There is usually no way to fix a biased sample and no way to salvage useful information from it. The best way to avoid bias is to select individuals for the sample at random. –The value of deliberately introducing randomness is one of the great insights of Statistics.

6
Landon v.s. Roosevelt in 1936

7
The Literary Digest The poll results pointed to a Landon victory over Roosevelt, indicating that he would get some 57% of the vote.

8
Why was Literary Digest poll wrong? Actually, Roosevelt polled 62.5% of the major-party vote and won 523 out of possible 531 electoral votes. Reason: The survey was done through sampling telephone numbers or drivers’ registrations. Only wealthy people were sampled. Therefore, the sample does not represent the population.

9
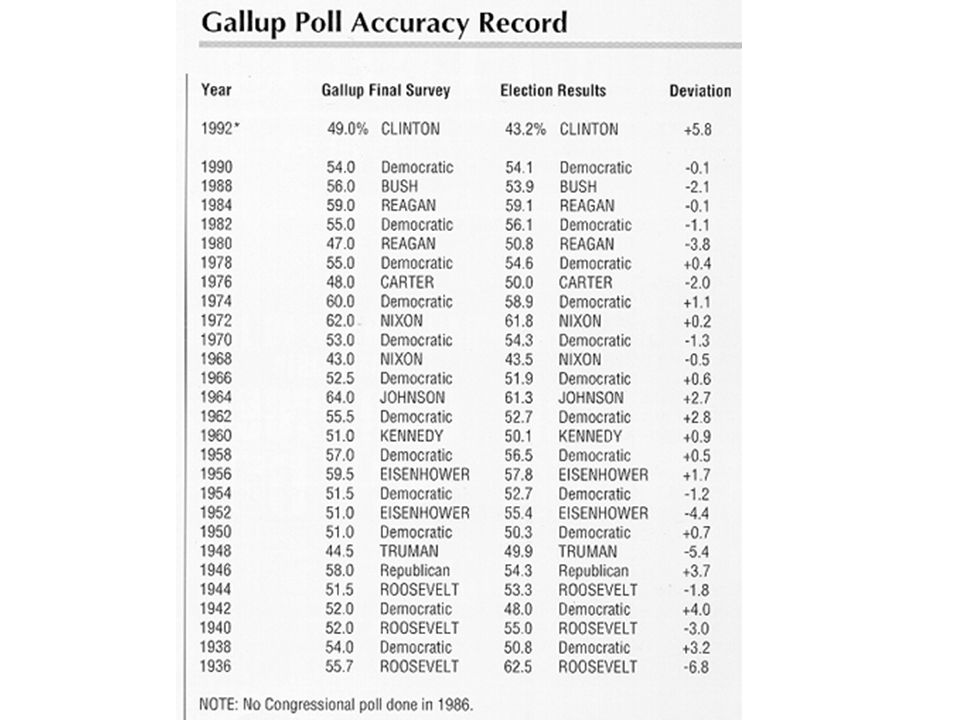
George H. Gallup In 1936, using a different sample of 50,000, Gallup predicted that Roosvelt would get 56% of the vote to Landon’s 44%.

11
To avoid biased samples, we should select individuals for the sample at random!

12
Idea 2 Randomization –Protect against both known and unknown factors –Make it possible to draw inference about the population based on the sample –Such inferences are among the most powerful things we can do with Statistics. –But remember, it’s all made possible because we deliberately choose things randomly.

13
Idea 3: It’s the Sample Size How large a random sample do we need for the sample to be reasonably representative of the population? It’s the size of the sample, not the size of the population or the fraction of the population that you’ve sampled, that makes the difference in sampling. –Exception: If the population is small enough and the sample is more than 10% of the whole population, the population size can matter. In general, larger sample size always makes the results more precise.

14
Does a Census Make Sense? Why bother determining the right sample size? Wouldn’t it be better to just include everyone and “sample” the entire population? –Such a special sample is called a census.

15
Does a Census Make Sense? (cont.) There are problems with taking a census: –It can be difficult to complete a census—there always seem to be some individuals who are hard to locate or hard to measure. –Populations rarely stand still. Even if you could take a census, the population changes while you work, so it’s never possible to get a perfect measure. –Taking a census may be more complex than sampling.
 There are problems with taking a census: –It can be difficult to complete a census—there always seem to be some individuals who are hard to locate or hard to measure. –Populations rarely stand still. Even if you could take a census, the population changes while you work, so it’s never possible to get a perfect measure. –Taking a census may be more complex than sampling..")
16
Populations and Parameters Models use mathematics to represent reality. –Parameters are the key numbers in those models. A parameter that is part of a model for a population is called a population parameter. We use data to estimate population parameters. –Any summary found from the data is a statistic. –The statistics that estimate population parameters are called sample statistics.

17
Population and parameters population Sample (data) parametersStatistics (estimates) unknown known
 parametersStatistics (estimates) unknown known")
18
Notation We typically use Greek letters to denote parameters and Latin letters to denote statistics. –Parameter –Estimate

19
Simple random samples We need to be sure that the statistics we compute from the sample reflect the corresponding parameters accurately. A sample that does this is said to be representative. We will insist that every possible sample of the size we plan to draw has an equal chance to be selected. –Such samples also guarantee that each individual has an equal chance of being selected. –With this method each combination of people has an equal chance of being selected as well. –A sample drawn in this way is called a Simple Random Sample (SRS).
..")
20
Simple Random Samples (cont.) To select a sample at random, we first need to define where the sample will come from. –The sampling frame is a list of individuals from which the sample is drawn. Once we have our sampling frame, the easiest way to choose an SRS is with random numbers.

21
Example Select 5 students from 80 enrolled in a class –Sampling frame: 80 enrolled students –Sample: 5 students Sample size: 5 1.Number the students from 1 to 80 2.Use your TI-83 to obtain five random integers between 1 and 80 (no repetition)
")
22
Another example Select 10% subjects in a huge sampling frame –Too tedious to number every subject –Give each subject a 10% chance to be selected –Then the sample size will be approximately 10% of the size of the sampling frame

23
Simple Random Samples (cont.) Samples drawn at random generally differ from one another. –Each draw of random numbers selects different people for our sample. –These differences lead to different values for the variables we measure. –We call these sample-to-sample differences sampling variability.

24
Stratified Sampling More complicated designs than SRS may save time or money or help avoid sampling problems. –Designs used to sample from large populations are often more complicated than simple random samples. Stratified random sampling –The population is first sliced into homogeneous groups, called strata. Then simple random sampling is used within each stratum before the results are combined.

25
Example Survey how students feel about funding for the football team Population: 60% men and 40% women Men and women are likely to have different views Sample size = 100 Simple random sampling –80 men and 20 women or 35 men and 65 women –The average opinion is biased toward men’s opinion or women’s opinion Stratified random sampling –60 men and 40 women –It maintains the gender balance and hence makes such samples more accurate in representing population opinion

26
Stratified Sampling (cont.) Stratified random sampling can reduce bias. Stratifying can also reduce the variability of our results. –When we restrict by strata, different samples are more like one another, so statistics calculated for the sampled values will vary less from one sample to another.

27
Cluster Sampling When stratifying isn’t practical and simple random sampling is difficult, splitting the population into similar parts or clusters can make sampling more practical, we could select one or a few clusters at random and perform a census within each of them. –If each cluster fairly represents the full population, cluster sampling will give us an unbiased sample.

28
Cluster Sampling (cont.) Cluster sampling is not the same as stratified sampling. –We stratify to ensure that our sample represents different groups in the population, and sample randomly within each stratum. Strata are homogeneous, but differ from one another. –Clusters are more or less alike, each resembling the overall population. We select clusters to make sampling more practical or affordable.

29
Example To assess the reading level of a book based on the length of the sentences Simple random sampling –A lot of sentences, too tedious Cluster sampling –Each page is a cluster –Within each page, we perform a census. –Assumption: the pages of the book are all similar in terms of reading level –This is more efficient

30
Multistage Sampling Sometimes we use a variety of sampling methods together. Sampling schemes that combine several methods are called multistage samples. Most surveys conducted by professional polling organizations use some combination of stratified and cluster sampling as well as simple random sampling.

31
Example To assess the reading level of a book based on the words used Randomly select one chapter from one part (stratified sampling) –Each part is a stratum Randomly select several pages from each of those chosen chapters (cluster sampling) –Each page is a cluster Randomly select a few sentences from each of those chosen pages (simple random sampling)
 –Each part is a stratum Randomly select several pages from each of those chosen chapters (cluster sampling) –Each page is a cluster Randomly select a few sentences from each of those chosen pages (simple random sampling)")
32
Systematic sampling Example –survey every 10 th person on an alphabetical list of students –Start from a randomly selected individual If the order of the list is not associated with the response, this gives a representative sample –Easier to implement than random sampling

33
Who’s Who? First, think about the population of interest. –Often, this may not be well defined. For example, who is exactly a student? –Even if the population is clear, it may not be a practical group to study. For example, those who will vote in the next election. Second, specify the sampling frame. –Usually, the sampling frame is not the group you really want to know about. –The sampling frame limits what your survey can find out. Then there’s your target sample, for example, determined by simple random sampling. –These are the individuals for whom you intend to measure responses. –You’re not likely to get responses from all of them—nonresponse is a problem in many surveys. Finally, there is your sample—the actual respondents. –These are the individuals about whom you do get data and can draw conclusions. –Unfortunately, they might not be representative of the sample, the sampling frame, or the population.

34
Who’s Who? (cont.) At each step, the group we can study may be constrained further. The Who keeps changing, and each constraint can introduce biases. A careful study should address the question of how well each group matches the population of interest.

35
The Valid Survey It isn’t sufficient to just draw a sample and start asking questions. Before you set out to survey, ask yourself: –What do I want to know? –Am I asking the right respondents? –Am I asking the right questions? –What would I do with the answers if I had them; would they address the things I want to know?

36
These questions may sound obvious, but they are a number of pitfalls to avoid. Know what you want to know. –Understand what you hope to learn and from whom you hope to learn it. Use the right frame. –Be sure you have a suitable sampling frame. Time your instrument. –The survey instrument itself can be the source of errors. –Longer questionnaires yield fewer responses The Valid Survey (cont.)
.")
37
Ask specific rather than general questions. –How much did you sleep last night? –How much do you usually sleep? Ask for quantitative results when possible. –How many hours did you sleep last night? Be careful in phrasing questions. –Does anyone in your family belong to a union? (What about my grandfather?) –Do you approve of the recent actions of the Secretary of Labor? (I have no idea.) –Did you drink too much last night? (I do not want to answer this question.) The Valid Survey (cont.)
 –Do you approve of the recent actions of the Secretary of Labor. (I have no idea.) –Did you drink too much last night. (I do not want to answer this question.) The Valid Survey (cont.).")
38
Even subtle differences in phrasing can make a difference. –After 9/11, President Bush authorized government wiretaps on some phone calls in the U.S. without getting court warrants, saying this was necessary to reduce the threat of terrorism. Do you approve or disapprove of this? –After 9/11, President Bush authorized government wiretaps on some phone calls in the U.S. without getting court warrants. Do you approve or disapprove of this?

39
The Valid Survey (cont.) Be careful in phrasing answers. –It’s often a better idea to offer choices rather than inviting a free response. –Do you support higher school taxes? Yes, it is important for our children. Yes, our future depends on it.

40
The best way to protect a survey from unanticipated measurement errors is to perform a pilot survey. –A pilot is a trial run of a survey you eventually plan to give to a larger group. The Valid Survey (cont.)
.")
41
What Can Go Wrong? Sample Badly with Volunteers: –In a voluntary response sample, a large group of individuals is invited to respond, and all who do respond are counted. Voluntary response samples are almost always biased, and so conclusions drawn from them are almost always wrong. –Voluntary response bias: Voluntary response samples are often biased toward those with strong opinions or those who are strongly motivated. People with negative opinions tend to respond more often than those with equally strong positive opinions

42
What Can Go Wrong? (cont.) Sample Badly, but Conveniently: –In convenience sampling, we simply include the individuals who are convenient. Unfortunately, this group may not be representative of the population. Internet surveys Surveys at shopping malls Survey interviewers tend to select individuals who look ‘safe’ or easy to interview –Convenience sampling is not only a problem for students or other beginning samplers. In fact, it is a widespread problem in the business world—the easiest people for a company to sample are its own customers.
 Sample Badly, but Conveniently: –In convenience sampling, we simply include the individuals who are convenient. Unfortunately, this group may not be representative of the population. Internet surveys Surveys at shopping malls Survey interviewers tend to select individuals who look ‘safe’ or easy to interview –Convenience sampling is not only a problem for students or other beginning samplers. In fact, it is a widespread problem in the business world—the easiest people for a company to sample are its own customers..")
43
What Can Go Wrong? (cont.) Sample from a Bad Sampling Frame: –An SRS from an incomplete sampling frame introduces bias because the individuals included may differ from the ones not in the frame. Undercoverage: –Many of these bad survey designs suffer from undercoverage, in which some portion of the population is not sampled at all or has a smaller representation in the sample than it has in the population. Telephone surveys are often done during dinner time, and hence reach people who often eat out less often.
 Sample from a Bad Sampling Frame: –An SRS from an incomplete sampling frame introduces bias because the individuals included may differ from the ones not in the frame. Undercoverage: –Many of these bad survey designs suffer from undercoverage, in which some portion of the population is not sampled at all or has a smaller representation in the sample than it has in the population. Telephone surveys are often done during dinner time, and hence reach people who often eat out less often..")
44
What Can Go Wrong? (cont.) Watch out for nonrespondents. –A common and serious potential source of bias for most surveys is nonresponse bias. –No survey succeeds in getting responses from everyone. The problem is that those who don’t respond may differ from those who do. And they may differ on just the variables we care about. –What do you expect the responses to the question “Do people like filling out questionnaires?” –Don’t make the survey too long. Surveys that are too long are more likely to be refused, reducing the response rate and biasing all the results.

45
What Else Can Go Wrong? (cont.) Work hard to avoid influencing responses. –Response bias refers to anything in the survey design that influences the responses. –Given the fact that those who understand Statistics are smarter and better looking than those who don’t, don’t you think it is important to take a course in Statistics?

46
How to Think About Biases Look for biases in any survey you encounter—there’s no way to recover from a biased sample of a survey that asks biased questions. Spend your time and resources reducing biases. If you possibly can, pretest your survey. Always report your sampling methods in detail.

47
What have we learned? A representative sample can offer us important insights about populations. –It’s the size of the sample, not its fraction of the larger population, that determines the precision of the statistics it yields. There are several ways to draw samples, all based on the power of randomness to make them representative of the population of interest: –Simple Random Sample, Stratified Sample, Cluster Sample, Systematic Sample, Multistage Sample

48
What have we learned? (cont.) Bias can destroy our ability to gain insights from our sample: –Nonresponse bias can arise when sampled individuals will not or cannot respond. –Response bias arises when respondents’ answers might be affected by external influences, such as question wording or interviewer behavior.
 Bias can destroy our ability to gain insights from our sample: –Nonresponse bias can arise when sampled individuals will not or cannot respond. –Response bias arises when respondents’ answers might be affected by external influences, such as question wording or interviewer behavior..")
49
What have we learned? (cont.) Bias can also arise from poor sampling methods: –Voluntary response samples are almost always biased and should be avoided and distrusted. –Convenience samples are likely to be flawed for similar reasons. –Even with a reasonable design, sample frames may not be representative. Undercoverage occurs when individuals from a subgroup of the population are selected less often than they should be.
 Bias can also arise from poor sampling methods: –Voluntary response samples are almost always biased and should be avoided and distrusted. –Convenience samples are likely to be flawed for similar reasons. –Even with a reasonable design, sample frames may not be representative. Undercoverage occurs when individuals from a subgroup of the population are selected less often than they should be..")
50
What have we learned? (cont.) Finally, we must look for biases in any survey we find and be sure to report our methods whenever we perform a survey so that others can evaluate the fairness and accuracy of our results.
 Finally, we must look for biases in any survey we find and be sure to report our methods whenever we perform a survey so that others can evaluate the fairness and accuracy of our results..")
Similar presentations