Download presentation
Presentation is loading. Please wait.

1
Investigation 2 Types of Data Michelle Ballentine Kendria Sutherlin Verra Williams

2
Quote It is a mathematical fact that 50% of all doctors graduate in the bottom of their class. ~Unknown

3
POD How many times can you subtract 7 from 83? What is left afterwards?

4
You can subtract it as many times as you want, and it leaves 76 every time. 83-7 =76

7
OBJECTIVE To note the kind of data being collected; that is categorical or numerical To use bar graphs to display categorical and numerical data To understand how measures of center (median, mode) and spread (range) relate to numerical and categorical data
 and spread (range) relate to numerical and categorical data")
10
Problem 2.1 From the graphs definitions you formed by doing IMOW, complete the following: A.Write two questions that have categorical data as answers. B.Write two questions that have numerical data as answers.

11
Journal Writing Problem 2.1 Follow-UP –Is it possible to find the mode of a set of categorical data? Explain your answer. THINKPAIR SHARE

12
Categorical

13
Numerical

14
HOMEWORK ACE problems 1-8 page 26

19
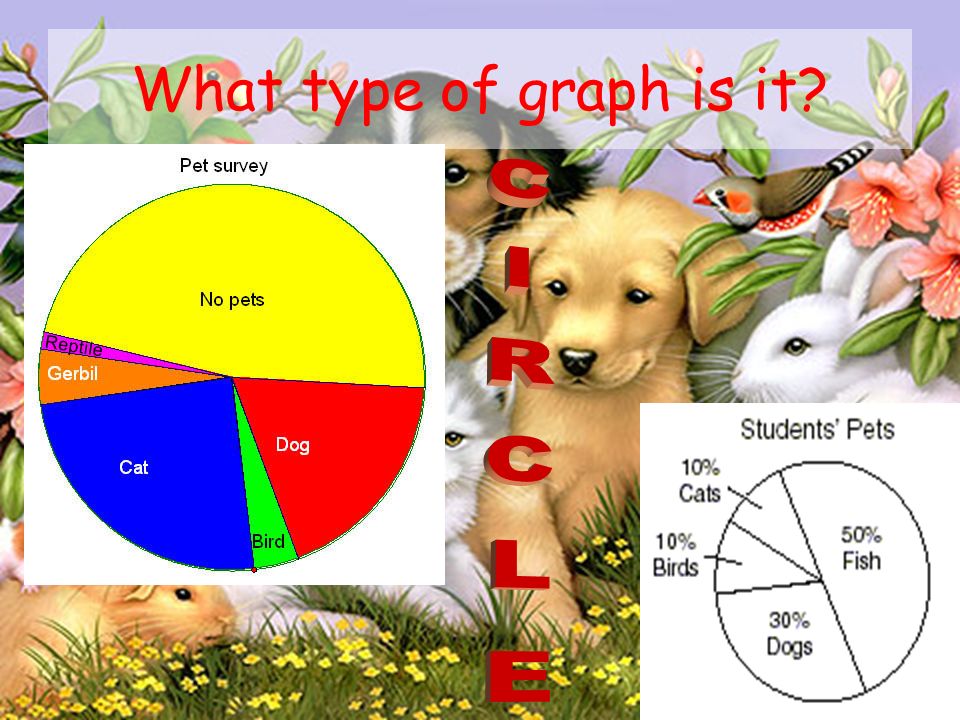
What type of graph is it?

22
Classroom Activity Using animal crackers create the following: 1.Bar graph or line plot 2.Circle graph with the following: fraction, decimal & percent Make sure you graph has the following elements: Title, legend, labeled y-axis and x-axis Materials: Poster board, glue, animal crackers

23
Problem 2.2 Decide whether each question below can be answered by using data from the graphs the students created. If a question can be answered, explain why not and tell what additional information you would need to answer the question.

24
A.Which graph show categorical data, and which graph shows numerical data? B.What is the total number of pets the students have? C.What is the greatest number of pets that any student in the class has? D.How many students are in the class? E.How many students chose cats as their favorite kind of pet?

25
F.How many cats do students have as pets? G.What is the mode for the favorite kind of pet? H.What is the median number of pets students have? I.What is the range of the numbers of pets students have? J.Tomas is a student in this class. How many pets does he have? K.Do the girls have more pets than the boys?

26
Journal Writing Follow-Up 2.2 –Do you think the students surveyed live in a city, the suburbs, or the country? Explain your answer.

27
HOMEWORK ACE Problems #’s: 9-14 pages 26-28

28
JOURNAL REFLECTIONS Page 29 Problems 1-3

29
WORD WALL Mode Range Average (mean) Measures of center Median Bar graph Line plot Categorical numerical
 Measures of center Median Bar graph Line plot Categorical numerical")
30
ACOS Standard 1 Standard 2 Standard 10

Similar presentations


Use the situation below to help you answer parts (a)-(e) Students collected data from their classmates.>")


