Download presentation
Presentation is loading. Please wait.

1
Improved understanding of global tropospheric ozone integrating recent model developments Lu Hu (luhu@seas.harvard.edu) With Daniel Jacob, Xiong Liu, Patrick Kim, Katie Travis, Lin Zhang Acknowledgement: Johan Schmidt, Ploy Achakulwisut, Lu L. Shen, Bob Yantosca, Melissa Sulprizio, NASA/GMAO

2
1-yr benchmarks from Bob Yantosca and Melissa Sulprizio Updated isoprene scheme (OH +8.4%) [Mao et al. 2013] Including Br chemistry (OH - 4.2%) [Parrella et al. 2012] Updated lightning NOx (OH +3.2%) [Murray et al. 2012] Evolution of GEOS-Chem, reflecting the advancement of knowledge Introduced GEOS-FP OH: -4.2 % P(Ox): -10%
 [Parrella et al. 2012] Updated lightning NOx (OH +3.2%) [Murray et al. 2012] Evolution of GEOS-Chem, reflecting the advancement of knowledge Introduced GEOS-FP OH: -4.2 % P(Ox): -10%.")
3
Introducing GEOS-FP reduces free tropospheric O 3 by 0-10 ppbv GEOS-Chem with GEOSFP– with GEOS5 GEOS-FP meteorological fields (since June 2012): Higher temporal and horizontal resolution Weaker convection Lower temperature lower global isoprene emission (by 20%) July mean O 3 at 500 hPa:
: Higher temporal and horizontal resolution Weaker convection Lower temperature lower global isoprene emission (by 20%) July mean O 3 at 500 hPa:")
4
Objective: Evaluate GEOS-Chem with the observations for global tropospheric ozone, and diagnose model weaknesses, using – Ozonesondes (vertical gradient) – OMI satellite data (global distribution) Question : Do recent updates improve our ability to model tropospheric ozone?
 – OMI satellite data (global distribution) Question : Do recent updates improve our ability to model tropospheric ozone")
5
GEOS-FP generally improves simulated vertical distribution of ozone compared to sonde data for 2012/2013 (annual mean) Ozonesonde GEOS-FP GEOS-5 Ozonesonde data from WOUDC and NOAA/GMD
 Ozonesonde GEOS-FP GEOS-5 Ozonesonde data from WOUDC and NOAA/GMD")
6
Each point represents monthly mean O 3 at 500 hPa for a specific site GEOS-FP O 3 Also a remarkable job in capturing global tropospheric O 3 variability Mean bias ± StdDev

7
Comparison to bias-corrected OMI satellite data at 400-700 hPa for 2012/2013 [ppbv] OMI ozone data quality is not significantly degraded from 2008 (not shown). OMI O 3 data was corrected for biases (3.6 ppbv) relative to in situ ozonesonde data following the method by Zhang et al. (2010) OMI ozone data from X. Liu
![Comparison to bias-corrected OMI satellite data at hPa for 2012/2013 [ppbv] OMI ozone data quality is not significantly degraded from 2008 (not shown).](http://images.slideplayer.com/27/9234738/slides/slide_7.jpg "OMI O 3 data was corrected for biases (3.6 ppbv) relative to in situ ozonesonde data following the method by Zhang et al. (2010) OMI ozone data from X. Liu.")
8
Improved ability to model tropospheric ozone compared to early versions Zhang et al., 2010: v8-01-04, 4x5, GEOS-4, 2006, ‘old ’ isoprene chemistry, no Br Hu et al., [in prep]: v9-02, 2x2.5, GEOS-FP, 2012/2013
![Improved ability to model tropospheric ozone compared to early versions Zhang et al., 2010: v , 4x5, GEOS-4, 2006, ‘old ’ isoprene chemistry, no Br Hu et al., [in prep]: v9-02, 2x2.5, GEOS-FP, 2012/2013](http://images.slideplayer.com/27/9234738/slides/slide_8.jpg "Improved ability to model tropospheric ozone compared to early versions Zhang et al., 2010: v , 4x5, GEOS-4, 2006, ‘old ’ isoprene chemistry, no Br Hu et al., [in prep]: v9-02, 2x2.5, GEOS-FP, 2012/2013")
9
Global comparison to OMI satellite data Mean bias ± StdDev Each point represents seasonal mean O 3 at 400-700hPa for a model grid (2x2.5) Bias-corrected OMI ozone [ppbv] Bias at northern mid-latitude in winter partly due to satellite error
![Global comparison to OMI satellite data Mean bias ± StdDev Each point represents seasonal mean O 3 at hPa for a model grid (2x2.5) Bias-corrected OMI ozone [ppbv] Bias at northern mid-latitude in winter partly due to satellite error](http://images.slideplayer.com/27/9234738/slides/slide_9.jpg "Global comparison to OMI satellite data Mean bias ± StdDev Each point represents seasonal mean O 3 at hPa for a model grid (2x2.5) Bias-corrected OMI ozone [ppbv] Bias at northern mid-latitude in winter partly due to satellite error")
10
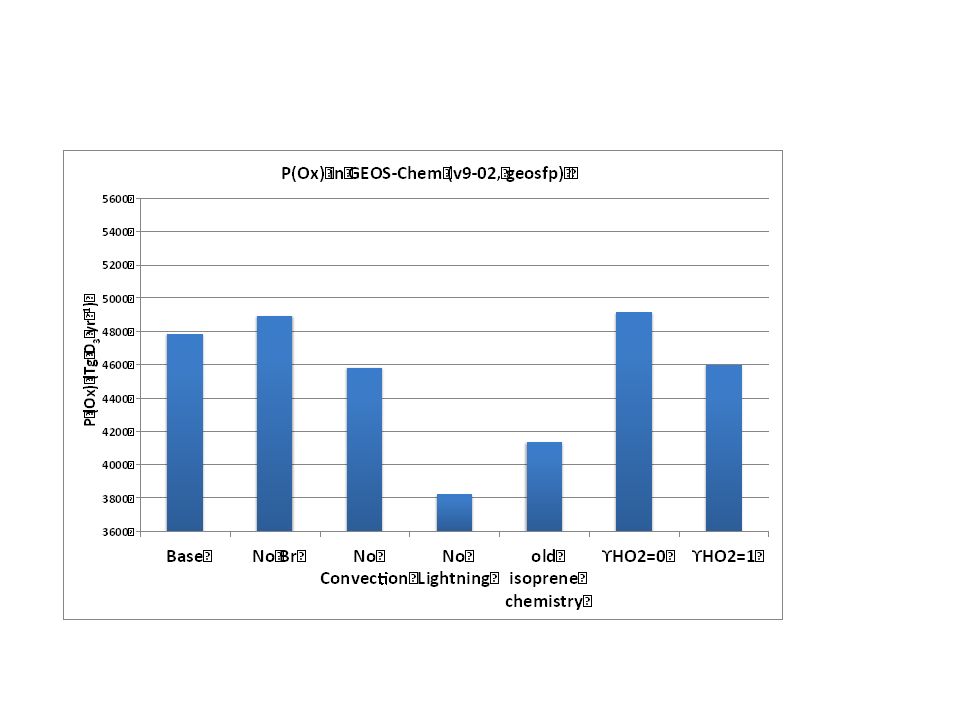
Improved ozone simulation is a result of advancing scientific knowledge of atmospheric processes controlling tropospheric ozone GEOS-4 GEOS-5 GEOS-FP Besides meteorological fields, P(Ox) is mostly sensitive to lightning NO x emission and isoprene chemistry
 is mostly sensitive to lightning NO x emission and isoprene chemistry")
11
Impact of isoprene chemistry on O 3 extends to free troposphere ‘old’ isoprene chemistry: Dry deposition is the only loss pathway for isoprene nitrate Turning off ISOPOOH+OH IEPOX Turning off isomerisation and self-reaction pathways of ISOPO2 Ozonesonde Base ‘old’ isoprene chemistry Ozone (ppbv)
")
12
Impact of isoprene chemistry on O 3 extends to free troposphere ‘old’ isoprene chemistry: Dry deposition is the only loss pathway for isoprene nitrate Turning off ISOPOOH+OH IEPOX Turning off isomerisation and self-reaction pathways of ISOPO2 Ozonesonde Base ‘old’ isoprene chemistry Ozone (ppbv) K. Travis Ozone (ppbv)
.")
13
Conclusions Recent model developments improve GEOS-Chem tropospheric ozone simulations, reflecting integrated improvements in lightning NO x source, isoprene chemistry, Br chemistry, and improved meteorological inputs. Tropospheric ozone simulation is mostly sensitive to model treatments in isoprene chemistry and lightning NO x emissions, and selection of meteorological inputs. Standard GEOS-Chem underestimates free tropospheric O 3 in the northern high latitudes. Standard GEOS-Chem still overestimates O 3 in the Southeast U.S., but this is likely caused by an overestimated US NEI NO x emission (K. Travis).
..")
14
Thanks!

15
Extra

16
40% reduction in Wet deposition of Ox Wet deposition: a minor term in O 3 budget, but could be important for modeling other species

17
Column total of convective mass flux Isoprene emission

18
Upper troposphere Ozonesonde GEOS-5 GEOS-4

20
Green numbers show the max and min biases relative to sondes Summer high biases in in west Pacific/Indonesia (also seen in 2008) due to OMI row anomaly, noise increase (Xiong Liu) Large biases in Spring and Winter over northern high latitudes; also occur for data before 2009 (not shown) Validating OMI measurements against ozonesondes (2011-2013)
 due to OMI row anomaly, noise increase (Xiong Liu) Large biases in Spring and Winter over northern high latitudes; also occur for data before 2009 (not shown) Validating OMI measurements against ozonesondes ( )")
21
High biases in >45N for Spring and Winter OMI O 3 is generally biased high 400-700 hPa: OMI vs sonde (OMI AK) Comparison for 2008 is similar (slightly better) to 2011-2013 Validating OMI measurements against ozonesondes (2011-2013)
 Comparison for 2008 is similar (slightly better) to Validating OMI measurements against ozonesondes ( )")
22
OMI ozone data quality is not significantly degraded from 2008

Similar presentations
, Larry Horowitz (GFDL), Vaishali Naik (GFDL), Meiyun Lin (GFDL), Arlene Fiore (Columbia.>")


 nadir stare ozone profiles using ozonesonde measurements during Arctic Research on the Composition.>")


 Both biomass and dust emissions in the Sahel during the winter season Emissions.>")


