Download presentation
Presentation is loading. Please wait.

1
Assessment & Planning All land ownerships All major upland systems

2
Integrated Landscape Assessment Project (ILAP): http://oregonstate.edu/inr/ilaphttp://oregonstate.edu/inr/ilap ILAP modeling software: ESSA Technologies’ VDDT & Path (www.essa.com)www.essa.com Fire and salvage Planting or natural regeneration Growth & succession
: ILAP modeling software: ESSA Technologies’ VDDT & Path ( Fire and salvage Planting or natural regeneration Growth & succession")
4
One State-and-Transition Model (STM) per PVT
 per PVT")
6
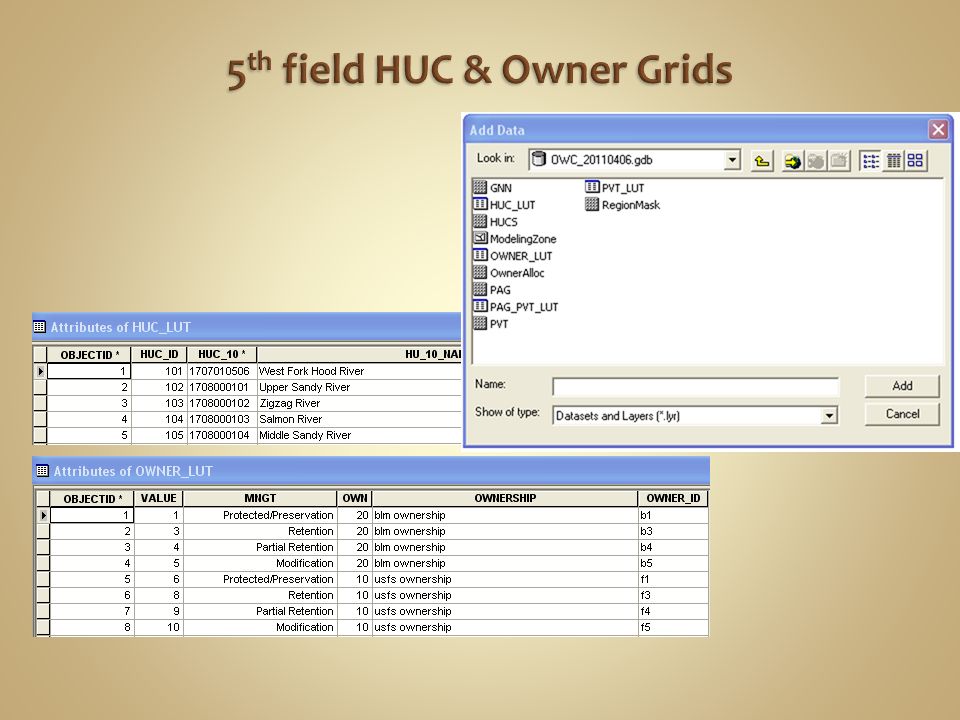
WatershedPVTOwnerModeling StrataArea 101OWC_fmhf5101_OWC_fmh_f510 101OWC_fmho1101_OWC_fmh_o16 102OWC_falf1102_OWC_fal_f115 Watershed Ownership-allocation Potential vegetation type

7
Current Veg Map (2006) Reclassified Veg Map (fwi PVT only) Table of current veg Key to translate from mapped current veg to model states Modeled states and acres for fwi PVT
 Reclassified Veg Map (fwi PVT only) Table of current veg Key to translate from mapped current veg to model states Modeled states and acres for fwi PVT")
8
Fuels Wildlife habitat Treatment finances Interpretations Watershed Design management scenario VDDT Models Wildfire-fuel hazards Terrestrial habitat Aquatic habitat Economic potential

9
Risk Low High Draft results – Subject to change

10
No Management – Year 50Restoration – Year 50 Risk Low High Draft results – Subject to change

11
Draft results – Subject to change Forest Service Other Federal Lands State Lands Tribal Lands Private Industry Saw Mill Current conditions 50 mile radius 05010025 Kilometers Percent of dry forest ownership within 50 miles of selected sawmills Risk Low High

12
Volume (1000 cubic feet)
")
13
Acres Year Acres Year No Management Restoration Northern Spotted Owl White Headed Woodpecker Draft results – Subject to change

14
Willamette NF’s Northwest Forest Plan Land Use Allocations (lrmpPub) MA14a & b (mgmt_alc field) and AMA & Matrix (Withhd field) -> “harvest-able” the rest of the USFS area -> “other” Timber area Other areas
 MA14a & b (mgmt_alc field) and AMA & Matrix (Withhd field) -> harvest-able the rest of the USFS area -> other Timber area Other areas")
15
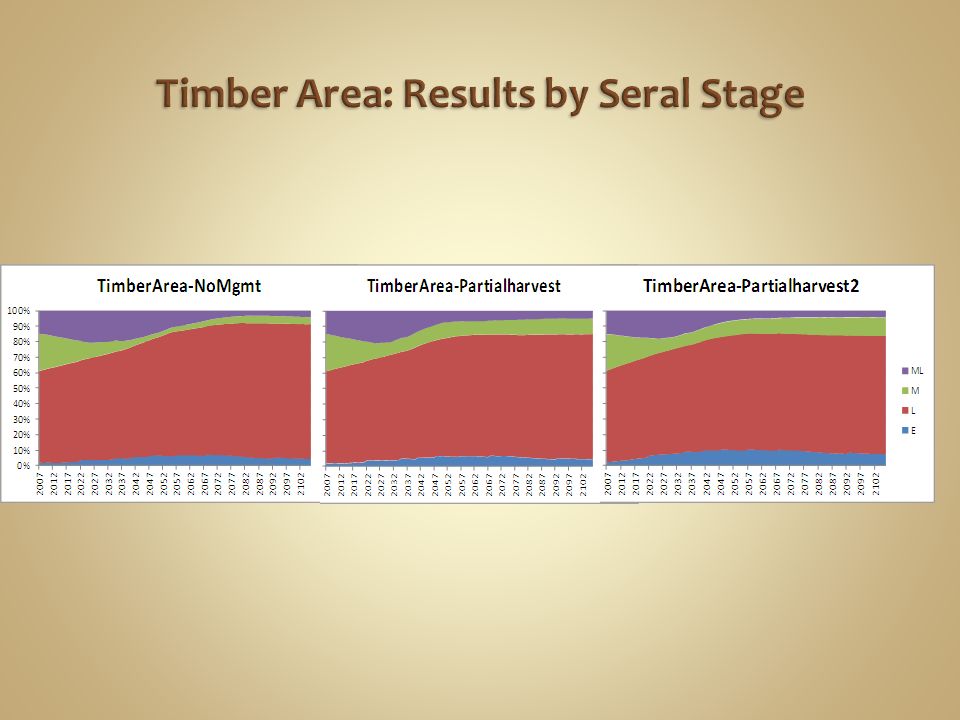
Partial harvest of stands 51-91 YO Assume 75% of area available for harvesting will actually be harvested Don’t harvest again for 25 years (min) Model States Size classes: small (10-15 “) & medium (15-20”) Annual transition probability =.75 /# years in a state
 Model States Size classes: small (10-15 ) & medium (15-20 ) Annual transition probability =.75 /# years in a state")
16
Partial Harvest 20% 80% Partial Harvest 2

17
Partial Harvest 1 Partial Harvest 2

18
Yr 2017 (time step 11): Begin harvesting Acres in med & small size classes under no mgmt scenario = 5,000 Harvest 500/ yr for 10 years Rest for 25 years then repeat Optimize treatments and costs with analyzer
: Begin harvesting Acres in med & small size classes under no mgmt scenario = 5,000 Harvest 500/ yr for 10 years Rest for 25 years then repeat Optimize treatments and costs with analyzer")
19
StateIDStrucNameStrucAbbrCoverAbbrStart AgeEnd AgeAG_SeralStageAG_SeralStage2AG_SizeAG_Density 122700Pole_med_singlePm1DF2650MMPoleMedium 22700GrassForbGFDF110EEGrassForbNA 242700Smtree_med_multiSm2DF5170MMSmtreeMedium 252700Smtree_close_multiSc2DF5170MMSmtreeClosed 272700Mdtree_single_PostDistM1pDF71100MLLMdtreeOpen 312700Mdtree_med_multiMm2DF71100MLLMdtreeMedium

23
Generate initial conditions for VDDT/Path Combine/simplify initial conditions strata Summarize Path output Graph summarized Path output The full meal deal

24
End of Presentation Materials

Similar presentations


 project update and discussion.>")

>")


>")


