Download presentation
Presentation is loading. Please wait.

1
Statistics on Frequency Departure from 60 Hz in The Eastern Interconnection Priority-based Control Engineering (PCE) Tel: 614 799 0300 --- email: pce@pce-co.com PCE Priority-based Control Engineering
 Tel: PCE Priority-based Control Engineering")
2
PCE-2 Information Presented in the Bar- Charts The pictures displayed in section 1 show the number of times that frequency in the Eastern Interconnection in an average 365-day period in the studied interval remained higher or lower than 60 Hz by the indicated threshold for more than the number of minutes shown on the horizontal axis. See slides 4 and 5 for examples of reading the bar-charts. The pictures displayed in section 2 are created using the same method as those in section 1, except the fact that they only consider events where frequency was less than 60 Hz. Section 3 describes the data we used to create the bar-charts. Double-click on the charts to view the Excel file used to create that chart.

3
PCE-3 Section 1 (Frequency is Higher or Lower than 60 Hz)
")
4
PCE-4 Example 1. The height of the multi-colored bar at minute 0 indicates that the frequency was above or below 60 Hz for at least one 6-second sample by: 30 mHz in about 55,000 occasions, turquoise bar in slide 11. 50 mHz in about 3,000 occasions, yellow bar in slide 12. 55 mHz in about 1,450 occasions, purple bar in slide 12. 60 mHz in about 650 occasions, blue bar in slide 12.

5
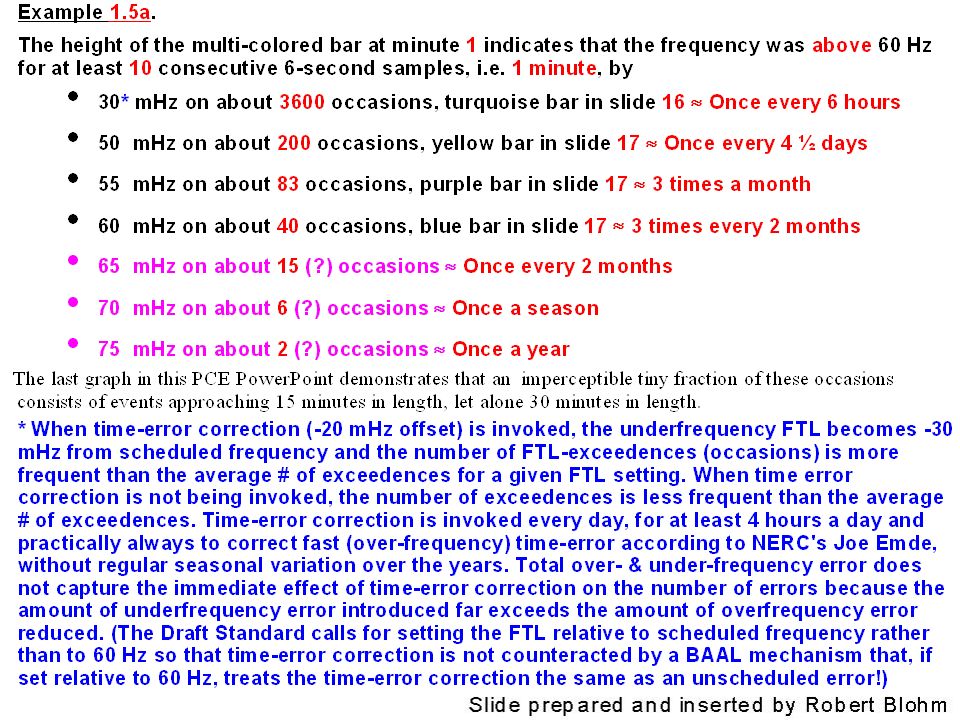
Example 1.5. The height of the multi-colored bar at minute1 indicates that the frequency wasabove or below 60 Hz for at least10 consecutive 6-second samples, i.e.1 minute, by: 30mHz on about7000 occasions, turquoise bar in slide11 Once every 3 hours 50mHz on about325 occasions, yellow bar in slide12 Once every 3 days 55mHz on about140 occasions, purple bar in slide12 Once a week 60mHz on about55 occasions, blue bar in slide13 Twice a month 65mHz on about20 (?) occasions Once a month. 70mHz on about7 (?) occasions Once a season 75mHz on about2 (?) occasions Once a year
 occasions Once a month. 70mHz on about7 ( ) occasions Once a season 75mHz on about2 ( ) occasions Once a year.")
7
Example2a. The height of the multi-colored bar at minute 5 indicates that the frequency wasbelow 60 Hz for at least 50 consecutive 6-second samples, i.e. 5 minutes, by: 30mHz on about250 occasions, turquoise bar in slide17 Once every 5 days 50mHz on about12 occasions, yellow bar in slide18 Once every 2 ½ months 55mHz on about5 occasions, purple bar in slide18 Once a season 60mHz on about2 occasions, blue bar in slide18 Once a year

8
PCE-8 Example 2. The height of the multi-colored bar at minute 5 indicates that the frequency was above or below 60 Hz for at least 50 consecutive 6-second samples, i.e. 5 minutes, by: 30 mHz in about 460 occasions, turquoise bar in slide 12. 50 mHz in about 20 occasions, yellow bar in slide 13. 55 mHz in about 8 occasions, purple bar in slide 13. 60 mHz in about 3 occasions, blue bar in slide 13.

10
Example2b. The height of the multi-colored bar at minute 5 indicates that the frequency wasabove 60 Hz for at least 50 consecutive 6-second samples, i.e. 5 minutes, by: 30mHz on about210 occasions Once every 5 days 50mHz on about8 occasions Once every 4 months 55mHz on about3 occasions Once a year 60mHz on about1 occasion Once every 2 ½ years

11
PCE-11

12
PCE-12

13
PCE-13

14
PCE-14 Logarithmic Scale

15
PCE-15 Section 2 (Frequency is Lower than 60 Hz)
")
16
PCE-16 Negative Events Only

17
PCE-17 Negative Events Only

18
PCE-18 Negative Events Only

19
PCE-19 Negative Events Only Logarithmic Scale

20
PCE-20 Section 3

21
PCE-21 Frequency Data Frequency source was NB 6-second frequency data, provided by Elmer Bourque, covering 2002, 2003, and more than 10 months of 2004. Excludes 5/11/2002, 5/12/2002, 5/13/2002, 8/14/2003, and 8/15/2003, and a few short periods. In these periods –data was not reliable –data failed a reasonability check –operation was not typical (due to situations such as islanding) Values are normalized to find the expected values for a 365-day year.
 Values are normalized to find the expected values for a 365-day year..")
Similar presentations


. Day….. 1.Misleading GraphsMisleading Graphs 2.Frequency Tables and Tally ChartsFrequency Tables and Tally Charts.>")


 MODULE 2 NUMERICAL DATA REPRESENTATION.>")

