Download presentation
Presentation is loading. Please wait.

1
Unit 6 – confidence intervals
Sections 6.1 and 6.2

2
Confidence intervals When we take a sample and calculate the mean of a sample it will be used to estimate the population parameter.

3
Confidence intervals In order to determine the number of points a new high blood pressure medicine reduces a patient’s systolic measurement . A sample of 6 patients were given the medicine and their blood pressure was measured after the prescribe period of time. The number of points the blood pressure was reduce is listed below Calculate the Mean

4
Confidence intervals The pharmaceutical company knows the results of the high blood pressure medicine will React differently on another group of patients. When they report the results, they want to use an interval. They said we are 95% confidence the new blood pressure medicine will reduce patient’s blood pressure between 2 and 14 points.

5
Margin of error The distance from the sample mean and the lower and upper limits. Mean = 8 Lower limit = 2 8 – 2 = 6 Upper limit = – 8 = 6 Margin of Error = MOE = 6

6
How to calculate the margin of error
We know how to calculate the mean. Today we will discuss how to calculate the Margin of error.

7
Large sample confidence intervals for means

8
Large sample confidence intervals for means

9
Large sample confidence intervals for means

10
Page 318 #23

11
Page 318 #23

12
Page 318 #23

13
Page A publisher wants to estimate the mean length of time (in minutes) all adults spend reading newspapers. To determine this estimate, the publisher takes a random sample of 15 people and obtains the following results. 11, 9, 8, 10, 10, 9, 7, 11, 11, 7, 6, 9, 10, 8, 10 From past studies, the publisher assumes σ is 1.5 minutes and that the population of times is normally distributed.
 all adults spend reading newspapers. To determine this estimate, the publisher takes a random sample of 15 people and obtains the following results. 11, 9, 8, 10, 10, 9, 7, 11, 11, 7, 6, 9, 10, 8, 10. From past studies, the publisher assumes σ is 1.5 minutes and that the population of times is normally distributed.")
14
We will calculate a 99% Confidence Interval
Page 11, 9, 8, 10, 10, 9, 7, 11, 11, 7, 6, 9, 10, 8, 10 Calculate the mean We will calculate a 99% Confidence Interval Subtract 99% from 1 Divide by 2 Find the Z value from the Table 4. What is the population standard deviation σ?

15
What is the sample size n? Calculate the square root of n?
Page 11, 9, 8, 10, 10, 9, 7, 11, 11, 7, 6, 9, 10, 8, 10 Sample Mean = Z = 2.575 σ = 1.5 What is the sample size n? Calculate the square root of n? MOE = Z *σ/√n =

16
Lower Limit = Sample Mean – MOE Upper Limit = Sample Mean + MOE
Page 11, 9, 8, 10, 10, 9, 7, 11, 11, 7, 6, 9, 10, 8, 10 Sample Mean = Z = 2.575 σ = MOE = .997 ≈ 1.00 Lower Limit = Sample Mean – MOE Upper Limit = Sample Mean + MOE We are 99% confident that the mean length of time an adult reads the paper is between …

17
Confidence Interval What happens if Sample size n < 30 Population standard deviation is unknown. The Margin of Error formula must be changed to MOE = t*s/√n

18
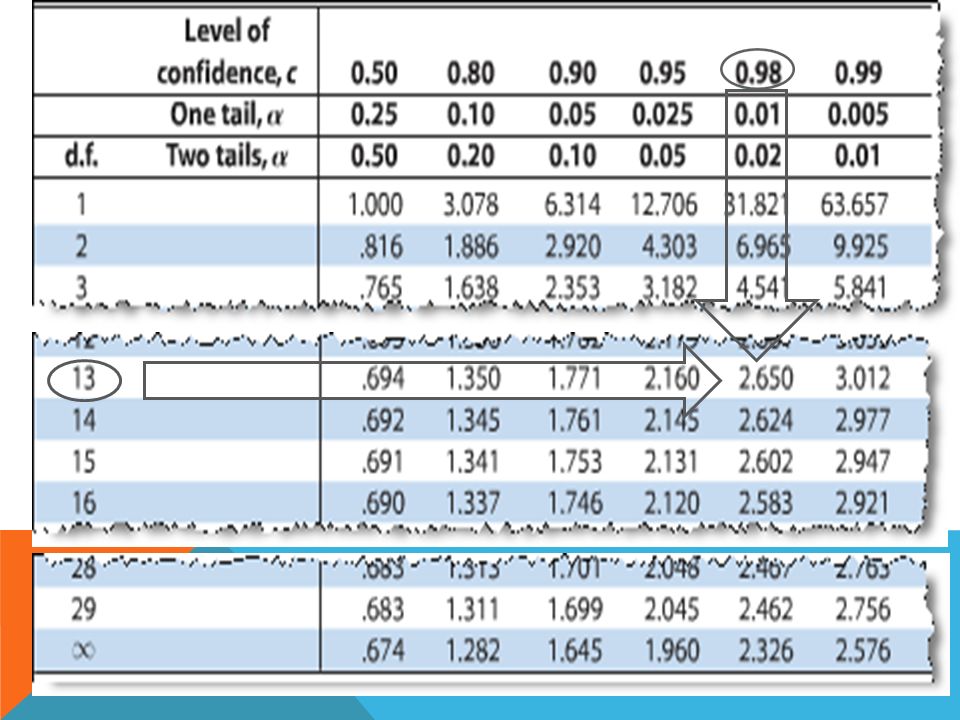
t distribution The t distribution was developed for small samples number (n < 30). It has characteristic similar to the normal distribution. Symmetric, Mean = Median = Mode Bell Shaped Extends forever to the left and the right.

19
Page #11

21
confidence interval – small sample size

22
Page 330 #14

23
confidence interval

Similar presentations


 Objective Find the confidence.>")


 © 2006 Prentice-Hall, Inc. Chap 8-1 Chapter 8 Confidence Interval Estimation Business Statistics, A First Course.>")
 (Small Samples)>")

>")


