Download presentation
Presentation is loading. Please wait.

1
The Chi-Square Distribution

2
Preliminary Idea Sum of n values of a random variable

3
Sum of Squares of random numbers

4
The distribution 1.It is called the chi-square distribution. 2.“Chi” rhymes with “High” – and the “ch” is pronounced like “k”. 3.It is a continuous random variable. 4.It has n – 1 degrees of freedom 5.It’s values are non-negative (i.e. ≥ 0) 6.It is always skewed to the right. 7.It becomes more symmetrical as n increases 8.It approximates a normal distribution for large values of n
 6.It is always skewed to the right. 7.It becomes more symmetrical as n increases 8.It approximates a normal distribution for large values of n.")
5
Two Chi-square distributions

6
The sample variance s 2 follows a chi-square distribution

7
Standardizing the Test Statistic In a test of hypothesis for a population variance σ 2, the test statistic is the sample variance s 2. The standardized test statistic is denoted by and is defined by: Note: The standardized values are found in the standard chi-square tables on page 7 in the Formulas and Tables handout.

8
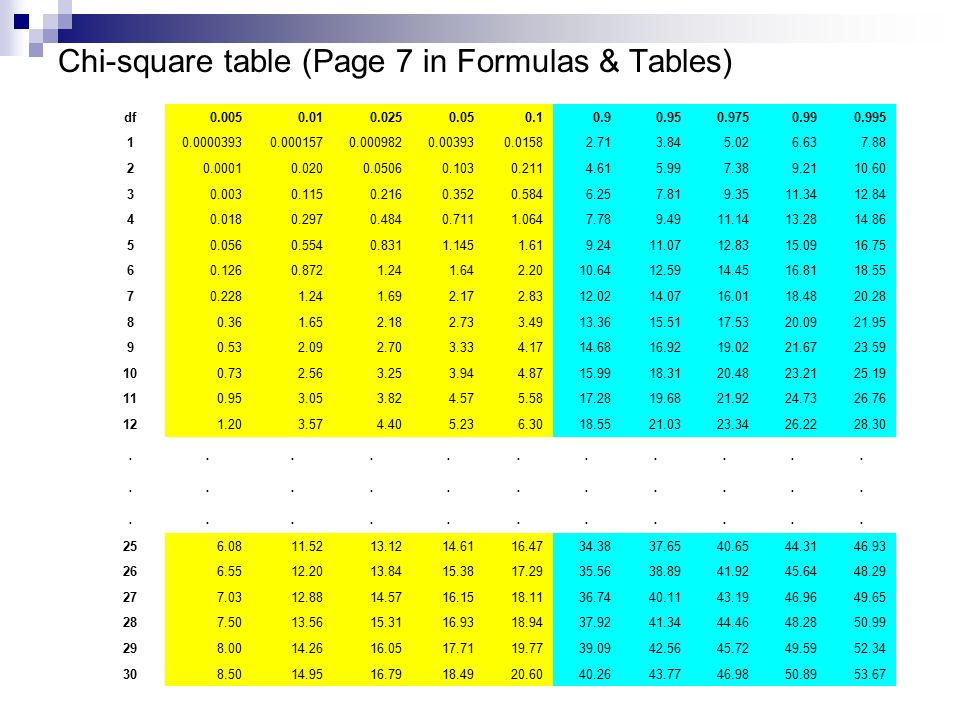
Chi-square table characteristics The chi-square tables are not symmetrical. Therefore lower-tail values and upper-tail values must be listed separately. In the extract of the chi-square tables shown in the next slide, lower-tail areas are shaded in yellow, upper tail areas are shaded in blue.

9
Chi-square table (Page 7 in Formulas & Tables) df0.0050.010.0250.050.10.90.950.9750.990.995 10.00003930.0001570.0009820.003930.01582.713.845.026.637.88 20.00010.0200.05060.1030.2114.615.997.389.2110.60 30.0030.1150.2160.3520.5846.257.819.3511.3412.84 40.0180.2970.4840.7111.0647.789.4911.1413.2814.86 50.0560.5540.8311.1451.619.2411.0712.8315.0916.75 60.1260.8721.241.642.2010.6412.5914.4516.8118.55 70.2281.241.692.172.8312.0214.0716.0118.4820.28 80.361.652.182.733.4913.3615.5117.5320.0921.95 90.532.092.703.334.1714.6816.9219.0221.6723.59 100.732.563.253.944.8715.9918.3120.4823.2125.19 110.953.053.824.575.5817.2819.6821.9224.7326.76 121.203.574.405.236.3018.5521.0323.3426.2228.30................................. 256.0811.5213.1214.6116.4734.3837.6540.6544.3146.93 266.5512.2013.8415.3817.2935.5638.8941.9245.6448.29 277.0312.8814.5716.1518.1136.7440.1143.1946.9649.65 287.5013.5615.3116.9318.9437.9241.3444.4648.2850.99 298.0014.2616.0517.7119.7739.0942.5645.7249.5952.34 308.5014.9516.7918.4920.6040.2643.7746.9850.8953.67
10
Chi-square table Examples

11
Two-Tail Test of Hypothesis

12
Lower Tail Test of Hypothesis

13
Upper Tail Test of Hypothesis

14
Example

15
The test of hypothesis

16
The F distribution

17
Comparison of Two Population variances We want to test the hypothesis that two population variances are equal, i.e. We need to rewrite the null and alternative hypotheses so that we can use a single value to represent the test statistic.

18
Ratio of Variances The null and alternative hypotheses are converted to the following form.

19
The Test Statistic A natural candidate to be the test statistic for the ratio of two population variances is the ratio of the corresponding sample variances

20
The F-distribution Statisticians have shown that the ratio of two chi-square variables follows a new distribution known as the F-distribution.

21
Extract of F-tables (1-α=.95) The F-distribution with 1 - α =.95 Denominatornumerator df df12345678910 1161.4199.5215.7224.6230.2234.0236.8238.9240.5241.9 218.5119.0019.1619.2519.3019.3319.3519.3719.3819.40 310.139.559.289.129.018.948.898.858.818.79 47.716.946.596.396.266.166.096.046.005.96 56.615.795.415.195.054.954.884.824.774.74 65.995.144.764.534.394.284.214.154.104.06 75.594.744.354.123.973.873.793.733.683.64 85.324.464.073.843.693.583.503.443.393.35 95.124.263.863.633.483.373.293.233.183.14 104.964.103.713.483.333.223.143.073.022.98 114.843.983.593.363.203.093.012.952.902.85 124.753.893.493.263.113.002.912.852.802.75 134.673.813.413.183.032.922.832.772.712.67 144.603.743.343.112.962.852.762.702.652.60 154.543.683.293.062.902.792.712.642.592.54
 The F-distribution with 1 - α =.95 Denominatornumerator df df")
22
F-distribution examples F(.95;4,9) = 3.63 F(.95;8,3) = 8.85 F(.99;15,20) = 3.09 F(.99;40,30) = 2.30
 = 3.63 F(.95;8,3) = 8.85 F(.99;15,20) = 3.09 F(.99;40,30) = 2.30")
23
Ratio of Variances We have already seen that for a sample of size n the sample variance has a χ 2 distribution with n - 1 degrees of freedom. It follows that the ratio of two variances

24
Test of Hypothesis for two variances

25
One-Tail Tests For Lower Tail Tests: A = F( ; n 1 - 1; n 2 - 1) For Upper Tail Tests: A = F(1 - ; n 1 - 1; n 2 - 1).
 For Upper Tail Tests: A = F(1 - ; n 1 - 1; n 2 - 1).")
26
Formula for Lower Tail F-values Since the lower tail F-values are not given in the table we must use the formulas:

27
Examples of Lower tail F-values F(.05;5,9)= 1/F(.95;9,5) = 1/4.77 = 0.2096 F(.05;7,4)= 1/F(.95;4,7) = 1/4.12 = 0.2427
= 1/F(.95;9,5) = 1/4.77 = F(.05;7,4)= 1/F(.95;4,7) = 1/4.12 =")
28
EXAMPLE The production manager of a textile company wants to test the hypothesis that the mean cost of producing a polyester fabric is the same for two different production processes. Assume that production costs are normally distributed for both processes. Random samples of production costs for several production runs using the two different production processes are as follows: Test the hypothesis that the two population variances are equal with a 2% level of significance. Process I $20$15$20$23$24$21 Process II $27$19$41$30$16

29
Sample Data Pop 1Pop 2 Sample size n 1 = 6n 2 = 5 Mean20.526.6 Variance9.997.3

30
Testing the Hypothesis

Similar presentations


 There are two types of hypothesis : 1) Simple hypothesis :A statistical.>")


 Test of Variance.>")


