Download presentation
Presentation is loading. Please wait.

1
1 Chapter 3: Project Management Chapter 22 & 23 in Software Engineering Book

2
2 Overview Why do we need software project management? Project management activities. Team formation. Project planning and scheduling. Risk management. Cost estimation.

3
3 By the end of this chapter, you will.. Know the principal tasks of software managers. Understand the need for planning in all software projects. Understand how graphical presentations can be used for project schedules. Understand the risk management process in software projects.

4
4 Good management guarantees project success. Do you agree?

5
5 Bad management results in project failure. Do you agree?

6
6 Why do we need software project management? Software engineering is subject to organisational budget and schedule constraints. Project managers ensure that software meets these constraints. How is software engineering different? Intangible products. Lack of standard software processes. One-off projects.

7
7 What does a project manager do? List the management tasks that you can think of with your team.

8
8 Project Management Activities Proposal writing, report writing and presentations. Team formation (selecting people to work on projects). Project planning and scheduling. Project cost estimation. Project monitoring and reviews (Quality assurance).
. Project planning and scheduling. Project cost estimation. Project monitoring and reviews (Quality assurance)..")
9
9 Team Formation Objective: having the right people in the right roles. Challenges in forming the ideal team: Budget may not allow for the use of highly-paid staff; Staff with the appropriate experience may not be available; An organisation may wish to develop employee skills on a software project. Project managers have to work within these constraints especially when there are shortages of trained staff.

10
10 Project Planning Probably the most time-consuming project management activity. Continuous activity Plans must be regularly revised as new information becomes available. Objective: determine 1. Resources available. 2. Work breakdown. 3. Schedule.

11
11 Project Planning Type of Project PlanDescription Quality Plan Describes the quality procedures and standards that will be used in a project. Validation Plan Describes the approach, resources and schedule used for system validation. Configuration Management Plan Describes the configuration management procedures and structures to be used. Maintenance Plan Predicts the maintenance requirements of the system, maintenance costs and effort required. Staff Development Plan Describes how the skills and experience of the project team members will be developed.

12
12 Project Planning Project Plan Structure: Introduction. Project organisation. Risk analysis. Hardware and software resource requirements. Work breakdown. Project schedule. Monitoring and reporting mechanisms.

13
13 Risk Management 1. Risk identification: what can go wrong. 2. Analyse risks: determine the likelihood that of occurrences and consequences. Prioritise risks by probability and impact. 3. Develop a risk plan. 4. Monitor to manage risks with high probability and high impact. Risk Identification Risk Analysis Risk Planning Risk Monitoring List of potential risks Prioritised risk list Risk avoidance & contingency plans Risk assessment

14
14 Risk Management Process: 1. Risk Identification Risk type Possible risks Technology The database used in the system cannot process as many transactions per second as expected. Software components that should be reused contain defects that limit their functionality. People It is impossible to recruit staff with the skills required. Key staff are ill and unavailable at critical times. Required training for staff is not available. Organisational The organisation is restructured so that different management are responsible for the project. Organisational financial problems force reductions in the project budget. Tools The code generated by CASE tools is inefficient. CASE tools cannot be integrated. Requirements Changes to requirements that require major design rework are proposed. Customers fail to understand the impact of requirements changes. Estimation The time required to develop the software is underestimated. The rate of defect repair is underestimated. The size of the software is underestimated.

15
15 Risk Management Process: 2. Risk Analysis and Prioritisation RiskProbabilityEffects Organisational financial problems force reductions in the project budget. LowCatastrophic It is impossible to recruit staff with the skills required for the project. HighCatastrophic Key staff are ill at critical times in the project.ModerateSerious Software components that should be reused contain defects which limit their functionality. ModerateSerious Changes to requirements that require major design rework are proposed. ModerateSerious The organisation is restructured so that different management are responsible for the project. HighSerious

16
16 Risk Management Process: 3. Risk Planning Develop strategies for managing risks: Avoidance strategies: The probability that the risk will arise is reduced; Minimisation strategies: The impact of the risk on the project or product will be reduced; Contingency plans: plans to deal with risks if they happen. RiskStrategyType of strategy? Staff illness Reorganise team to increase overlap of work people understand each other’s jobs. Minimisation strategy Defective components Replace potentially defective components with bought-in components of known reliability. Avoidance strategy Organisational financial problems Prepare a briefing document for senior management demonstrating how the project is making key contributions to the goals of the business. Contingency plan

17
17 Risk Management Process: 4. Risk Monitoring Regularly assessing each of the identified risks: Are the risks becoming more or less probable? Have any changes occurred to the effects of the risks on the project? Risk typePotential indicators TechnologyLate delivery of hardware or support software, many reported technology problems. PeoplePoor staff morale, poor relationships amongst team member, job availability. OrganisationalOrganisational gossip, lack of action by senior management Tools Reluctance by team members to use tools, complaints about CASE tools, demands for higher-powered workstations. RequirementsMany requirements change requests, customer complaints. EstimationFailure to meet agreed schedule, failure to clear reported defects.

18
18 Work Breakdown Activities in a project should be organised to produce tangible outputs for management to judge progress. Milestones are the end-point of a process activity. Deliverables are project results delivered to customers. To establish milestones the software process must be broken down into basic activities with associated outputs.

19
19 Milestones and Deliverables Deliverables

20
20 Project Scheduling Project scheduling process: Split project into tasks. For each task, estimate time & resources. Organise tasks concurrently to make optimal use of workforce. Minimise task dependencies. Depends on project manager’s intuition and experience.

21
21 Bar Charts and Activity Networks Graphical notations used to illustrate the project schedule. Show project breakdown into tasks. Tasks should not be too small. They should take about a week or two. Activity charts show task dependencies and the critical path. Bar charts show schedule against calendar time.

22
22 The Activity of Building a House Start Build fence Build Frame Design landscaping Walls & Interiors FinishPaint

23
23 Activity Networks Start Build fence Build Frame Design landscaping Walls & Interiors FinishPaint Frame Fence Construction Complete Activity Milestone

24
24 Activity Networks Start Build fence Build Frame Design landscaping Walls & Interiors FinishPaint Frame Fence Construction Complete 100 days 10 days 30 days Critical Path Longest path Activity Milestone

25
25 Activity Networks Start T3: Build fence T1: Build Frame T4: Design landscaping T2: Walls & Interiors Finish T5: Paint M1 Frame M2 Fence M3: Construction Complete 100 days 10 days 30 days Critical Path Longest path Activity Milestone ActivityDurationDependencies T1: Build Frame100 days T2: Walls & Interiors100 daysT1 (M1: Frame) T3: Build Fence10 days T4: Design Landscaping30 daysT3 (M2: Fence) T5: Paint10T2,T4 (M3: Construction Complete)
 T3: Build Fence10 days T4: Design Landscaping30 daysT3 (M2: Fence) T5: Paint10T2,T4 (M3: Construction Complete)")
26
26 Task Duration & Dependencies ActivityDuration (days)Dependencies T18 T215 T315T1 (M1) T410 T510T2, T4 (M2) T65T1, T2 (M3) T720T1 (M1) T825T4 (M5) T915T3, T6 (M4) T1015T5, T7 (M7) T117T9 (M6) T1210T11 (M8)
Dependencies T18 T215 T315T1 (M1) T410 T510T2, T4 (M2) T65T1, T2 (M3) T720T1 (M1) T825T4 (M5) T915T3, T6 (M4) T1015T5, T7 (M7) T117T9 (M6) T1210T11 (M8)")
27
27 Activity Network

28
28 Activity Bar Chart

29
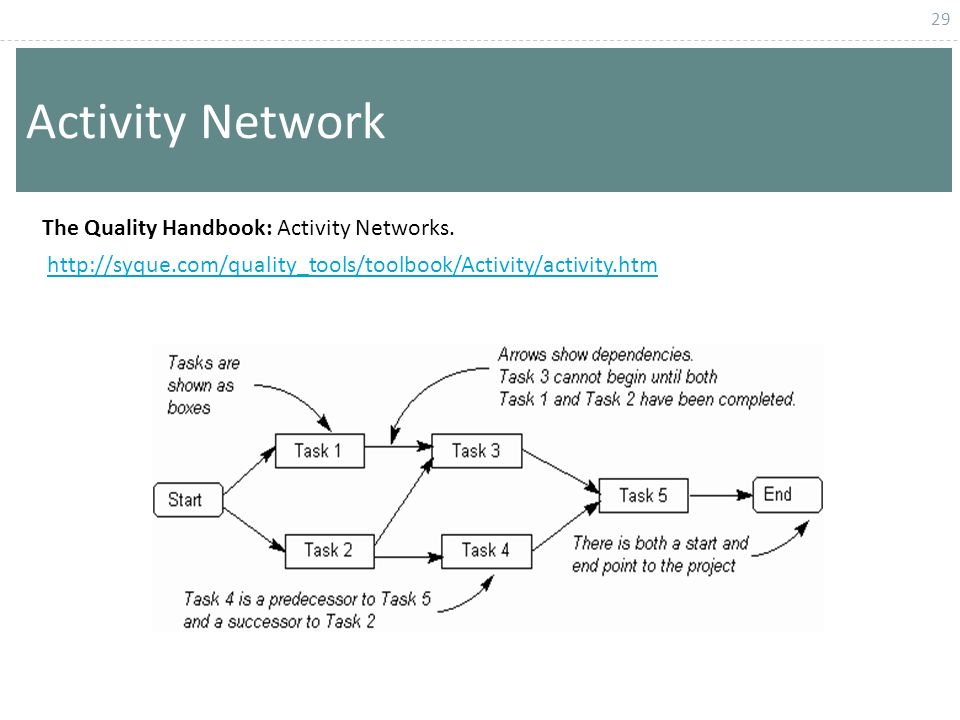
29 Activity Network The Quality Handbook: Activity Networks. http://syque.com/quality_tools/toolbook/Activity/activity.htm
30
30 Activity Network

31
31 Project Cost Estimation What are the parameters involved in computing the total cost of a software development project? 1. Hardware and software costs including maintenance. 2. Travel and training costs. 3. Effort costs (paying software engineers). For most projects, the dominant cost in software development is effort cost.
. For most projects, the dominant cost in software development is effort cost..")
32
32 Project Cost Estimation Algorithmic cost modelling. Expert judgment. Estimation by analogy. Parkinson’s law. Pricing to win. For large projects it is advisable to use several cost estimation techniques and compare the results.

Similar presentations


 MANAGEMENT Efficient &>")


