Download presentation
Presentation is loading. Please wait.

1
Preservice teachers’ understandings of what makes a fractions model “linear” Steven Boyce

2
What image comes to mind when you read the following words: “three- fifths”? The numbers 3 and 5? 60%? A subset of 3 items within a set of 5 items? A bar partitioned into 5 pieces with 3 of the pieces shaded? What images would you believe to be most common for students in 212?

3
Background There are 5 recognized sub-constructs for fractions learning (Kieren, 1979) Measure, Operator, Part-whole, Quotient, and Ratio. School-based instruction in the U.S. has traditionally emphasized part-whole and ratio interpretations. The Common Core State Standards for School Mathematics places early emphasis on understanding fractions as measures.

4
3.NF.1, 2, 3 1.Understand a fraction 1/b as the quantity formed by 1 part when a whole is partitioned into b equal sized parts; understand a fraction a/b as the quantity formed by a parts of size 1/b. 2.Understand a fraction as a number on the number line; represent fractions on a number line diagram. a.Represent a fraction 1/b on a number line diagram by defining the interval from 0 to 1 as the whole and partitioning it into b equal parts. Recognize that each part has size 1/b and that the endpoint of the part based at 0 locates the number 1/b on the number line. b.Represent a fraction a/b on a number line diagram by marking off a lengths 1/b from 0. Recognize that the resulting interval has size a/b and that its endpoint locates the number a/b on the number line. 3.Explain equivalence of fractions in special cases, and compare fractions by reasoning about their size.

5
3.NF.1, 2, 3 1.Understand a fraction 1/b as the quantity formed by 1 part when a whole is partitioned into b equal sized parts; understand a fraction a/b as the quantity formed by a parts of size 1/b. 2.Understand a fraction as a number on the number line; represent fractions on a number line diagram. a.Represent a fraction 1/b on a number line diagram by defining the interval from 0 to 1 as the whole and partitioning it into b equal parts. Recognize that each part has size 1/b and that the endpoint of the part based at 0 locates the number 1/b on the number line. b.Represent a fraction a/b on a number line diagram by marking off a lengths 1/b from 0. Recognize that the resulting interval has size a/b and that its endpoint locates the number a/b on the number line. 3.Explain equivalence of fractions in special cases, and compare fractions by reasoning about their size.

6
Why is it important for students to learn to represent fractions using number lines? It’s going to appear in some form on high-stakes assessments This means it will be taught in some manner! Teachers should know why the number line representation receives privileged treatment, so that they can support the intent of the Standards. Goal for my 212 class – how might I support my students in understanding what is important about their future students learning to represent fractions on number lines?

7
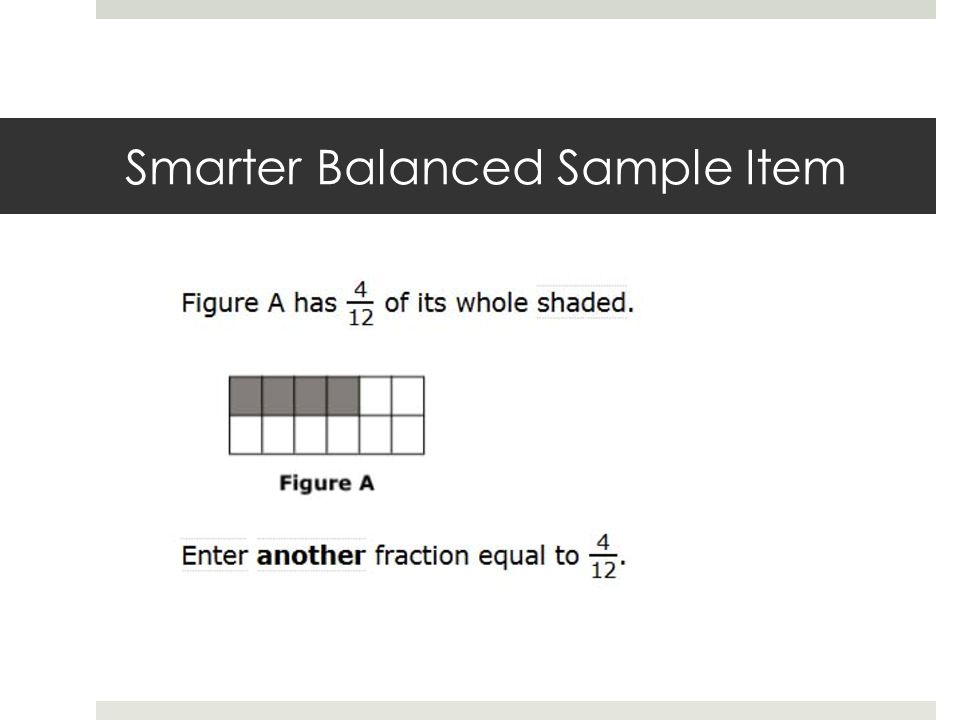
Third Grade Smarter Balanced Sample Item

8
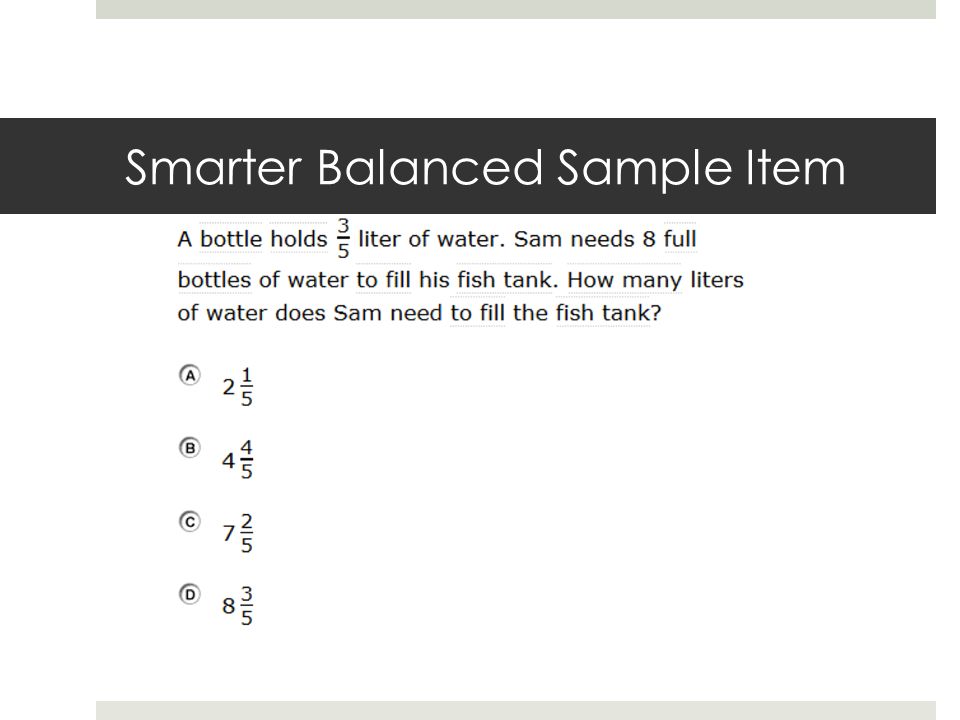
3 rd Grade Sample Item

9
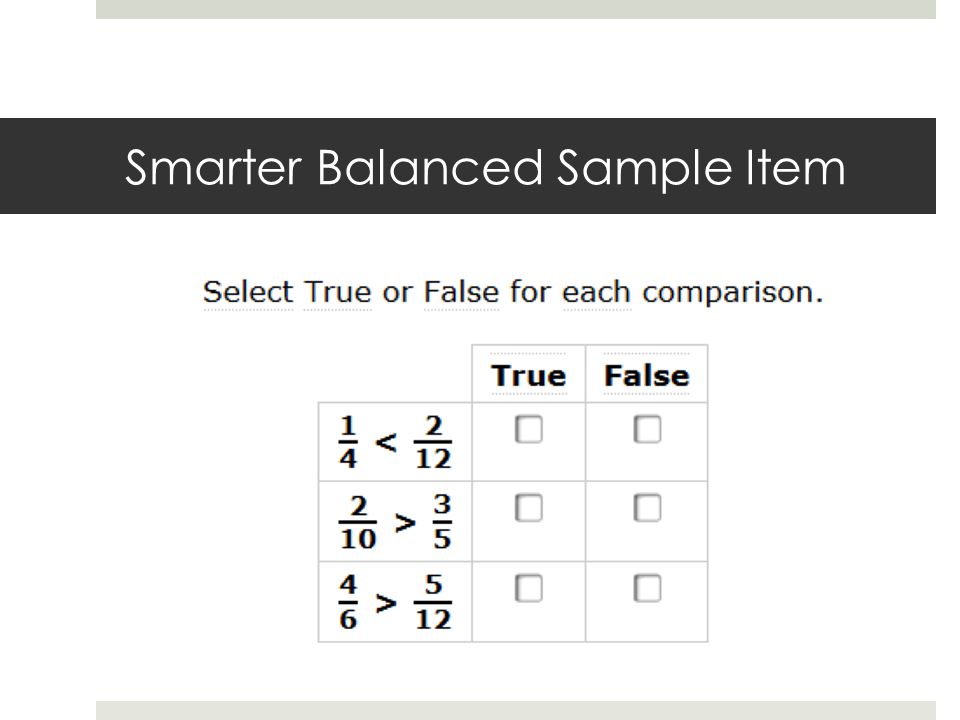
Another 3 rd grade Sample Item

10
But,… Are number line representations really that important? Fourth and fifth grade standards begin to use the term “visual fraction model”. Number line diagrams arise in understanding decimal fractions, e.g. 4.NF.6, … “locate 0.62 on a number line diagram” and with negative numbers. Don’t appear again until 6 th grade, 6.NS.6, “Understand a rational number as a point on a number line.”

11
4.NF.3, 4.NF.4.a Understand a fraction a/b with a > 1 as a sum of fractions 1/b. Understand a fraction a/b as a multiple of 1/b. For example, use a visual fraction model to represent 5/4 as the product 5 x (1/4), recording the conclusion by the equation 5/4 = 5 x 1/4.
, recording the conclusion by the equation 5/4 = 5 x 1/4..")
12
5.NF.5 Interpret multiplication as scaling (resizing)by: a.Comparing the size of a product to the size of one factor, based on the size of the other factor, without performing the indicated multiplication. b.Explaining why multiplying a given number by a fraction greater than 1 results in a product greater than the given number (recognizing multiplication by whole numbers as a familiar case); explaining why multiplying a given number by a fraction less than 1 results in a product smaller than the given number; and relating the principle of fraction equivalence a/b = (n x a) / (n x b) to the effect of multiplying a/b by 1.
; explaining why multiplying a given number by a fraction less than 1 results in a product smaller than the given number; and relating the principle of fraction equivalence a/b = (n x a) / (n x b) to the effect of multiplying a/b by 1..")
13
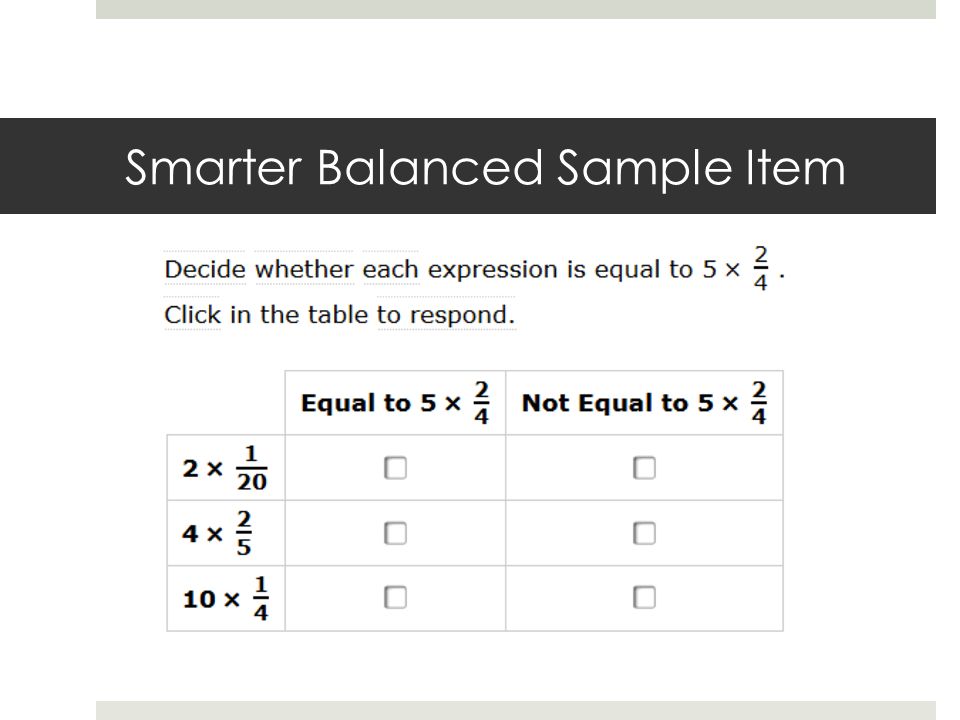
Smarter Balanced Sample Item

18
Sample Smarter Balanced Item

19
Prospective Elementary Teachers’ Understanding of Fractions Most students are accustomed to thinking of fractions as a number of equivalent parts out of a whole (Olanoff, Lo, & Tobias, 2014). When asked to compare proper fractions 3/5 and 5/8, some of my PTs use multiplication find a common denominator and compare 24/40 to 25/40. When asked to represent their thinking with a drawing, the product is often a rectangle, partitioned into 40 pieces from left to right. Other times it is of a rectangle, partitioned into 40 pieces using an array model

20
Rectangular Models used to represent comparison of 3/5 and 5/8 PTs creating either representation identify 24 and 25 of these parts as overlapping contiguous amounts.

21
Prospective Elementary Teachers’ Understanding of Fractions

22
Figurative Models used to compare 3/5 and 5/8 When using same-size parts, PTs explain that they compare ratios of the form (parts chosen):(parts not chosen) Students partition one of the circles into five equal size parts and shade in three contiguous parts; they similarly form 5/8 with the other circle
:(parts not chosen) Students partition one of the circles into five equal size parts and shade in three contiguous parts; they similarly form 5/8 with the other circle")
23
Linear, Set, or Area Models? Students using Figurative Representations may be inclined to think fractions 3/5 and 5/8 are equivalent. Instead of focusing on the particular aspects that make this difficult, I encourage students to first reflect on whether they used linear, set, or area models.

24
Linear, Set, or Area Model? 01 Now, could label 24/40 and 25/40 on the number line

25
Figures 2, 3, and 4 are… Figure 2 is identified as an area model Figure 3 is identified as a set model Figure 4 is identified as an area model To perturb students’ thinking about what it means for a fractions model to be linear, I ask them to consider how a circle representation of a fraction could also be considered linear.

26
Here’s the idea: The circumference of a circle has the same (proportional) relationship with the circle’s area as a rectangle’s side length has with its area. Repeat the reasoning previously resulting in conception of Figure 1 as a linear model. one can consider an arclength instead of a sector just as one can consider length of a segment instead of area of a rectangle.

27
Repeated Reasoning I ask the PTs to represent 3/5 and 5/8 on two number lines the same way they represented 3/5 and 5/8 using two equivalent circles. The line segments should not intersect and should be the same length. They should separately identify the amount of m connected parts after partitioning each line segment into n parts. The same operations are used to compare sizes with the circle diagram.

28
Partitioning versus Iterating To form 3/5 using a circle model, partition the circle into five equivalent parts of 1/5 each, and then form 3/5 by connecting three of these parts. Area units are really not a consideration! Idea is that students are iterating a (curvi)linear unit The purpose of introducing the number line diagram is to help elementary students construct fractions schemes that include both partitioning and iterating
linear unit The purpose of introducing the number line diagram is to help elementary students construct fractions schemes that include both partitioning and iterating.")
29
Advantage of the rectangular linear model versus the circular linear model Consideration of improper fractions Improper fractions are numbers that result from iterating beyond the whole, which can be represented using a number line model by iterating a unit fraction past 1 Ask PTs – how could they represent 5/3 using a circle model?

30
Outcomes Most students in the class could successfully use rectangular linear representations to depict improper fractions as sizes. E.g., given a rectangular bar representing 2/3, find a rectangular bar representing 5/4. Future plans include investigations of the differences in the ways students use circle graphs before and after the activity. Most students were quite comfortable with circle graphs, but emphasized parts-within-wholes meanings. Curious how students might make sense of non-standard circle graphs, in which the whole is not necessarily a single circle.

Similar presentations

Pink: whole 2)Green:halves, fourths, eighths 3)Yellow:thirds, sixths, ninths 4)Blue:twelfths Note.>")

 This material.>")


