Download presentation
Presentation is loading. Please wait.

1
Correlation Chapter 6

2
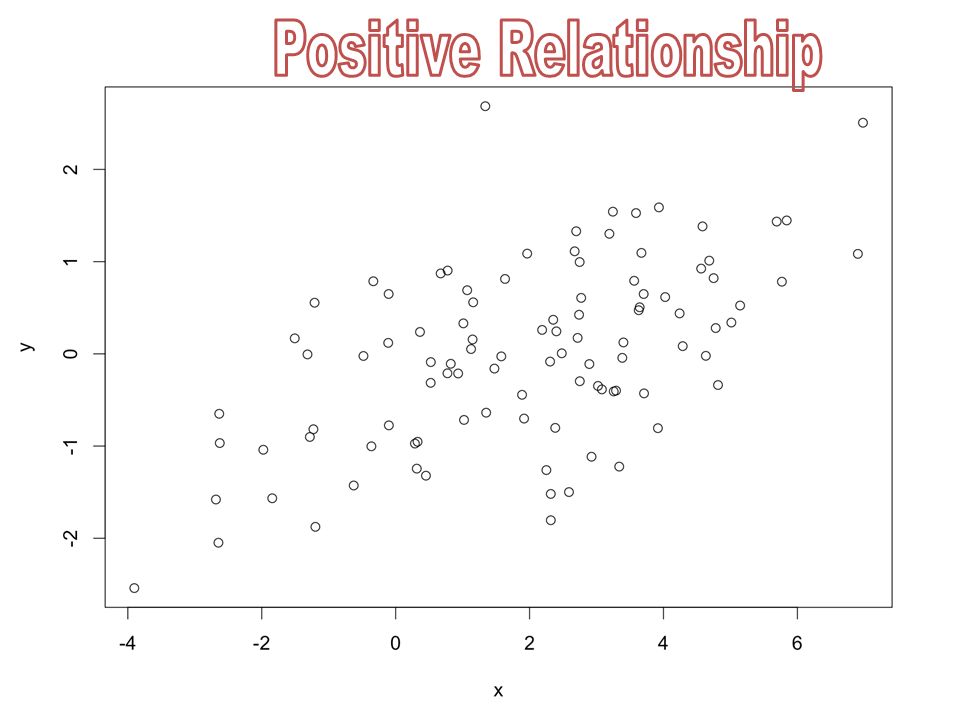
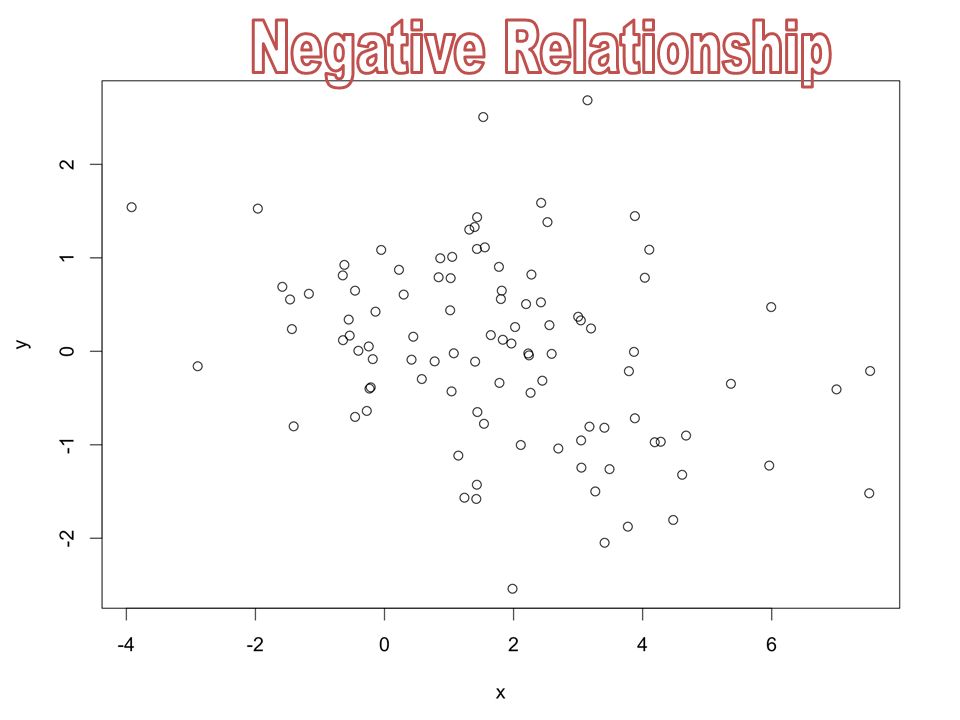
What is a Correlation? It is a way of measuring the extent to which two variables are related. It measures the pattern of responses across variables.

6
Scatterplots Plotting reminder – ggplot(data, aes(X, Y, color/fill = categorical) – + theme coding – + geom_point() to get the dots – + geom_smooth() to get a line – + xlab/ylab
 – + theme coding – + geom_point() to get the dots – + geom_smooth() to get a line – + xlab/ylab")
7
Scatterplots Not only do you need to check X and Y for proper labels Now you need to make sure X and Y are appropriate lengths for your scatterplot – Although this rule is less strictly enforced than the bar graph rule.

8
Fix the X/Y Axes coord_cartesian(xlim = NULL, ylim = NULL) coord_cartesian(xlim = c(0,100), ylim = c(0,100))
 coord_cartesian(xlim = c(0,100), ylim = c(0,100))")
9
Modeling Relationships First, look at some scatterplots of the variables that have been measured. Outcome i = (model ) + error i Outcome i = (bX i ) + error i b = beta = r when you have one predictor
 + error i Outcome i = (bX i ) + error i b = beta = r when you have one predictor.")
11
Modeling Relationships Outcome i = (model ) + error i – Previously, this was Mean + SE – And we used SE to determine if the model “fit” well.
 + error i – Previously, this was Mean + SE – And we used SE to determine if the model fit well.")
12
Modeling Relationships Outcome i = (bX i ) + error i Now we are using b or r or β (beta) to determine the strength of the model – Traditionally you don’t see the error values reported (sometimes you see CI)
 + error i Now we are using b or r or β (beta) to determine the strength of the model – Traditionally you don’t see the error values reported (sometimes you see CI)")
13
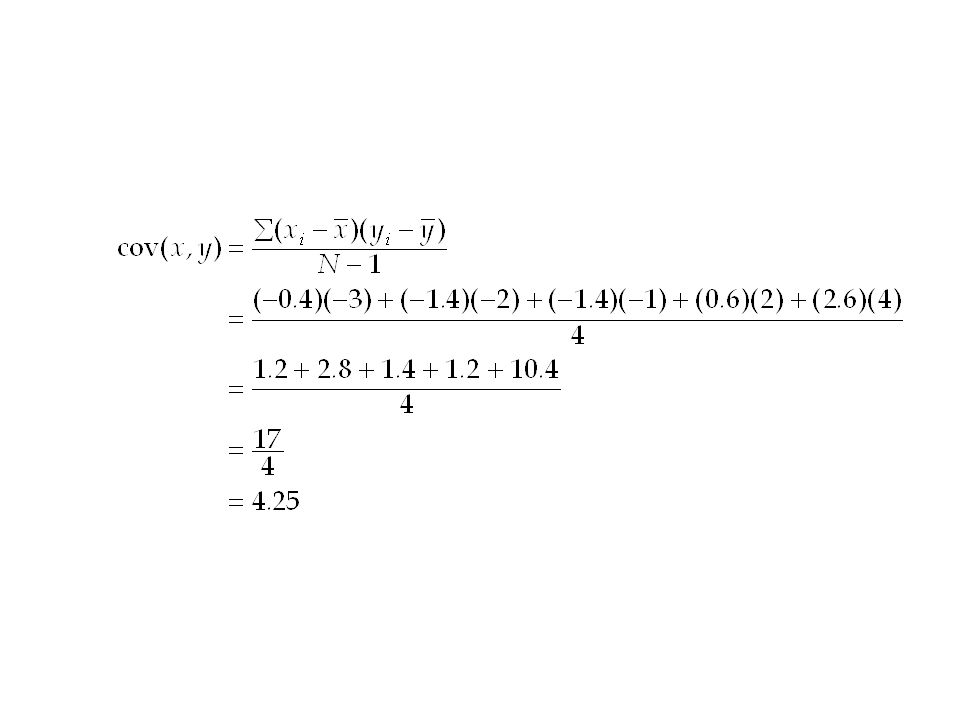
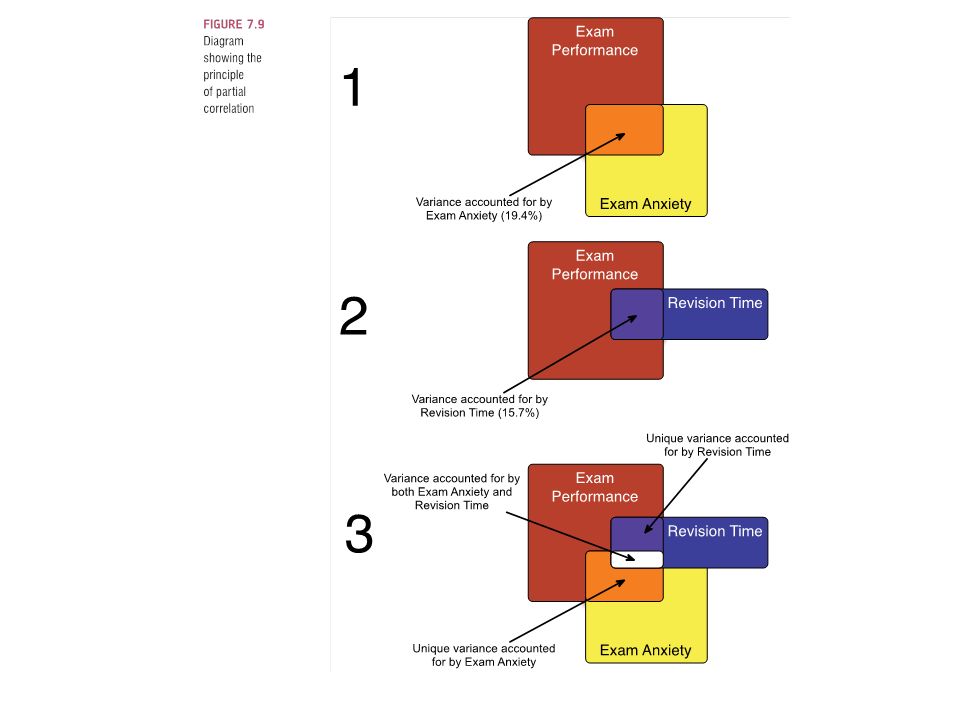
Measuring Relationships We need to see whether as one variable increases, the other increases, decreases or stays the same. This can be done by calculating the covariance. – We look at how much each score deviates from the mean. – If both variables deviate from the mean by the same amount, they are likely to be related.

14
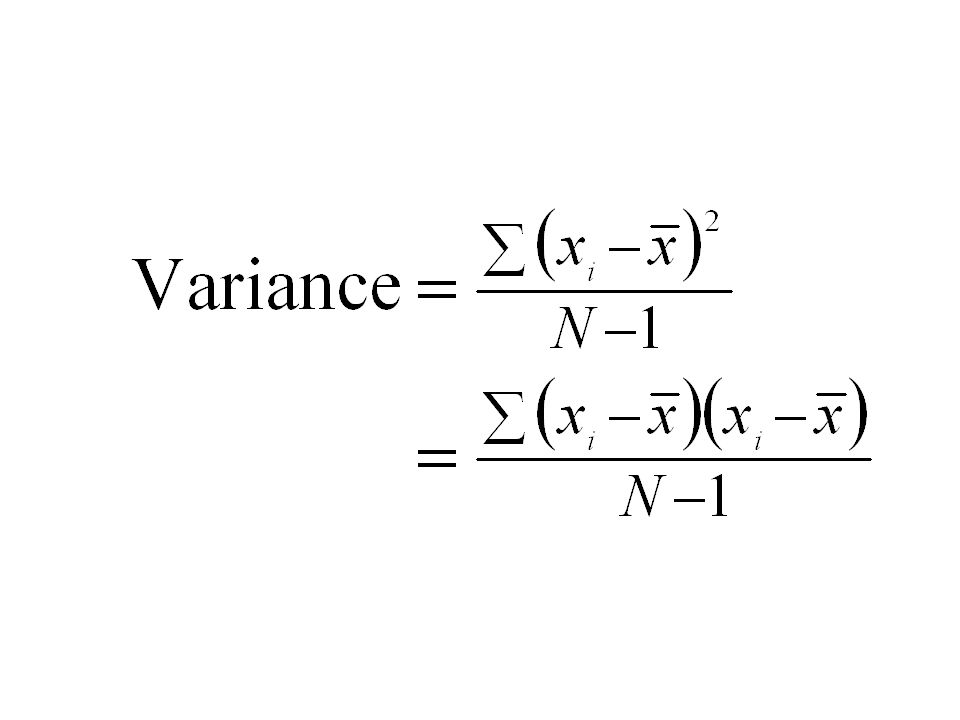
Revision of Variance The variance tells us by how much scores deviate from the mean for a single variable. It is closely linked to the sum of squares. Covariance is similar – it tells is by how much scores on two variables differ from their respective means.

21
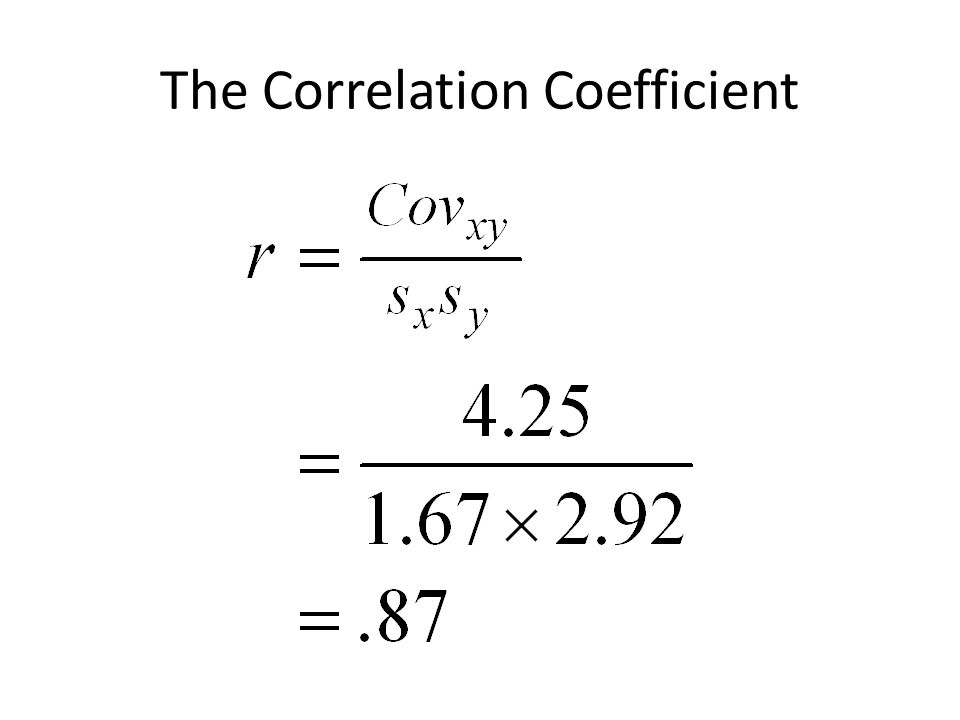
Problems with Covariance It depends upon the units of measurement. One solution: standardize it! – Divide by the standard deviations of both variables. The standardized version of covariance is known as the correlation coefficient. – It is relatively affected by units of measurement.

22
The Correlation Coefficient

24
Correlation Coefficient Basically, r values have the model + error built into one number – Instead of M + SE – So we can just look at r to determine “model fit” or strength of relationship.

25
Things to know about the Correlation It varies between -1 and +1 – 0 = no relationship It is an effect size – ±.1 = small effect – ±.3 = medium effect – ±.5 = large effect Coefficient of determination, r 2 – By squaring the value of r you get the proportion of variance in one variable shared by the other.

26
R versus r R = correlation coefficient for 3+ variables r = correlation coefficient for 2 variables r 2 = coefficient of determination for 2 variables R 2 = coefficient of determination for 3+ variables – In reality, we use R 2 for anything effect size related, even if it’s only 2

27
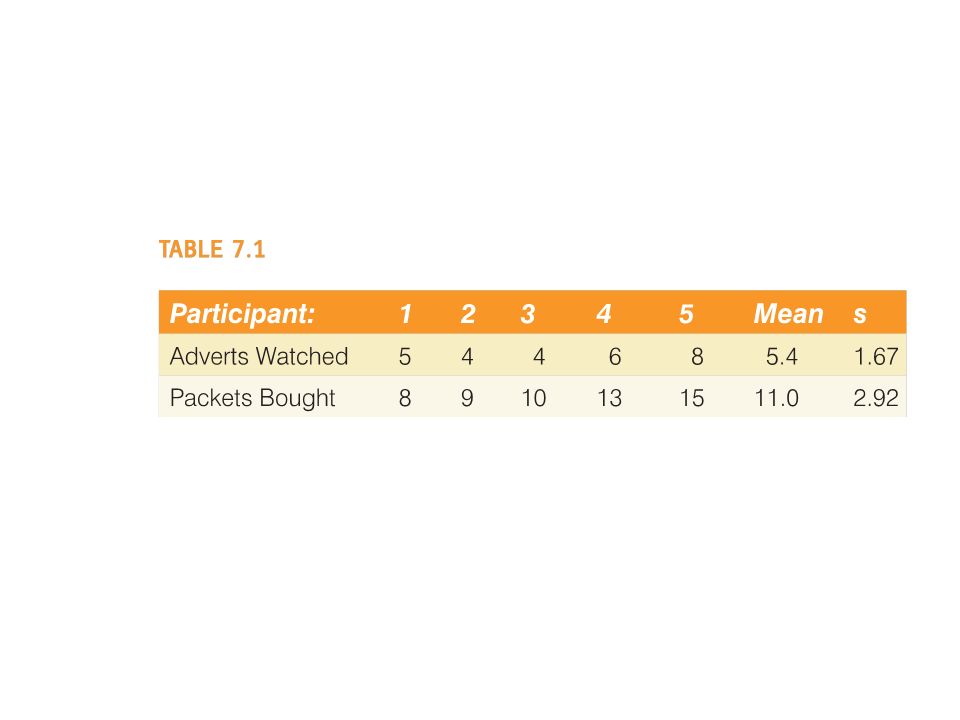
Correlation: Example Anxiety and Exam Performance Participants: – 103 students Measures – Time spent revising (hours) – Exam performance (%) – Exam Anxiety (the EAQ, score out of 100) – Gender
 – Exam performance (%) – Exam Anxiety (the EAQ, score out of 100) – Gender")
28
Assumptions Accuracy Missing (exclude pairwise if you don’t fill in) Outliers Normality Linearity** Homogeneity Homoscedasticity
 Outliers Normality Linearity** Homogeneity Homoscedasticity")
29
How to Calculate You’ve already been doing these! cor(x,y) But what about p values? We’ve only been looking at the magnitude of the correlation for assumption checks.

30
How to Calculate cor() function will calculate: – Pearson, Spearman, Kendall, multiple correlations at once rcorr() function will calculate: – Pearson, Spearman, p values, multiple correlations at once cor.test() function will calculate: – Pearson, Spearman, Kendall, p values, CI
 function will calculate: – Pearson, Spearman, Kendall, multiple correlations at once rcorr() function will calculate: – Pearson, Spearman, p values, multiple correlations at once cor.test() function will calculate: – Pearson, Spearman, Kendall, p values, CI")
31
cor output cor(examdata, use = “pairwise.complete.obs”, method = “pearson”) – Remember these all have to be numeric, no factor variables.
 – Remember these all have to be numeric, no factor variables.")
32
rcorr output rcorr(as.matrix(examdata), type = “pearson”) – Automatically does pairwise deletion. – All things must be numeric, as well as in matrix format – Load the Hmisc library for this function

33
rcorr output

34
cor.test output cor.test(x, y, method = “pearson”) – Must use single vectors/columns for x, y
 – Must use single vectors/columns for x, y")
35
Correlation Interpretation The third-variable problem: – In any correlation, causality between two variables cannot be assumed because there may be other measured or unmeasured variables affecting the results. Direction of causality: – Correlation coefficients say nothing about which variable causes the other to change.

36
Nonparametric Correlation Spearman’s Rho – Pearson’s correlation on the ranked data Kendall’s Tau – Better than Spearman’s for small samples – When lots of things have the same rank

37
Example World’s best Liar Competition – 68 contestants – Measures Where they were placed in the competition (first, second, third, etc.) Creativity questionnaire (maximum score 60) C6 liar.csv
 Creativity questionnaire (maximum score 60) C6 liar.csv")
38
Spearman/Kendall You can calculate: – Spearman and Kendall with cor() but no p values. – Spearman with rcorr() but no Kendall – All the things with cor.test() but one pair at a time.
 but no Kendall – All the things with cor.test() but one pair at a time..")
39
Spearman

40
Kendall

41
A note All values must be numeric to be able to do any of these correlations – Therefore, if you have any variables that import with labels, you will have defactor them. – as.numeric()
.")
42
Point vs not point Point/Biserial correlation = correlation with a dichotomous variable Which is which? – Point biserial = true dichotomy, no underlying continuum (i.e. gender) – Biserial = not quite discrete (i.e. pass/fail)
 – Biserial = not quite discrete (i.e. pass/fail).")
43
Point vs not point

44
Comparing Correlations A question I am asked a lot – how can I tell if these two correlation coefficients are significantly different? Install package cocor to be able to compare them!

45
Comparing Correlations First, you have to decide if the correlations are independent or dependent Independent correlations the correlations come from separate groups of people, but are on the same variables Dependent correlation the correlations are from the same people, but are different variables (overlapping or not)
")
46
Independent Correlations There’s no split/subset function within cocor. Therefore, you have to split up the dataset on your independent variable. – (and then put it back together in list format). Subset the data, then create a list.
. Subset the data, then create a list..")
47
Independent Correlations cocor(~ X + Y | X + Y, data = data) Fill in X and Y with your variables you want to correlate – (on these they are likely to be the same). Data = new list we just created.

48
Independent Correlations

49
Dependent Correlations cocor(~ X + Y | Y + Z, data = data) Fill in X, Y, Z with your variables you want to correlate – Overlapping correlation You can also have X + Y | Q + Z – Non-overlapping correlation Data is the dataframe with all of the columns
 Fill in X, Y, Z with your variables you want to correlate – Overlapping correlation You can also have X + Y | Q + Z – Non-overlapping correlation Data is the dataframe with all of the columns")
50
Dependent Correlations So much output!

51
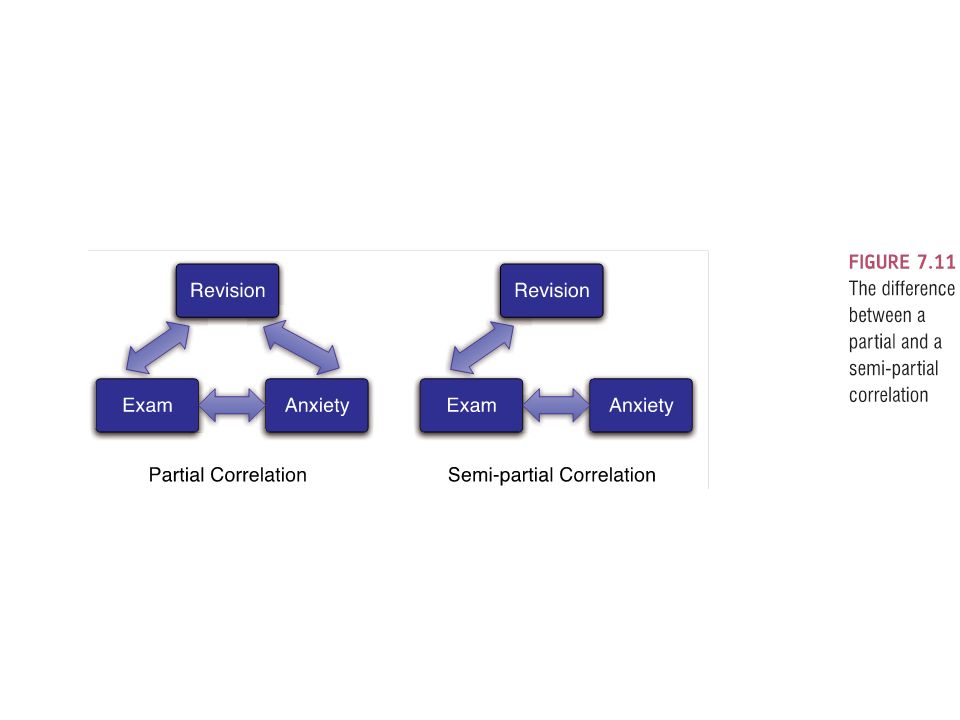
Partial and Semi-Partial Correlations Partial correlation: – Measures the relationship between two variables, controlling for the effect that a third variable has on them both. Semi-partial correlation: – Measures the relationship between two variables controlling for the effect that a third variable has on only one of the others.

54
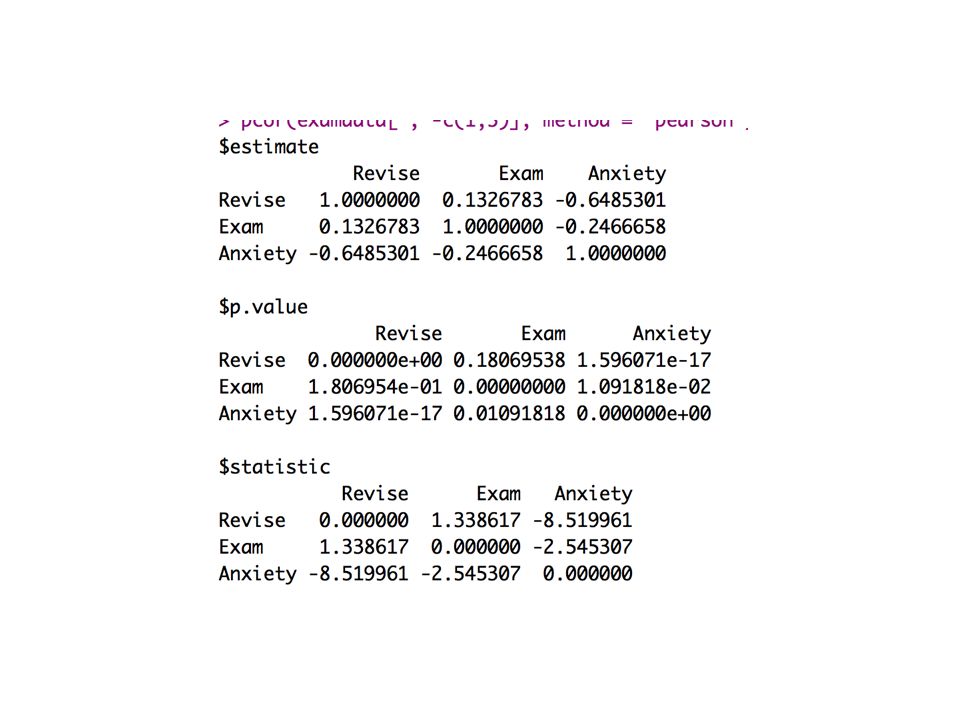
Partial Correlations Install ppcor package! pcor(dataset, method = “pearson”)
")
56
Semipartial Correlations spcor(data, method = “pearson”) Notice how top and bottom half are not equal. Calculated as: Correlation between 1 and 2, given that 2 and 3 are correlated. The first column = 1 The rest are 2/3

Similar presentations


 Association Between Variables Measured at the Interval-Ratio Level: Bivariate Correlation and Regression.>")


