Download presentation
Presentation is loading. Please wait.

1
Dennis Milbert, Ph.D. Bruce Parker, Ph.D. National Ocean Service, NOAA
Seamless Combination of Bathymetry and Topography: Transforming Vertical Datums Dennis Milbert, Ph.D. Bruce Parker, Ph.D. National Ocean Service, NOAA

2
Acknowledgements Collaboration of USGS and NOAA
National Ocean Service Coast Survey Coastal Services Center National Geodetic Survey Local Partners (so far) Florida Marine Research Institute Tampa Bay National Estuary Program Rookery Bay National Estuarine Research Reserve Port Authorities Future Partners Federal Emergency Management Agency U.S. Army Corp of Engineers
 Florida Marine Research Institute. Tampa Bay National Estuary Program. Rookery Bay National Estuarine Research Reserve. Port Authorities. Future Partners. Federal Emergency Management Agency. U.S. Army Corp of Engineers.")
3
Introduction What is a Datum? When Datums Don’t Match
The Shoreline/Datum Problem Categories of Datums VDatum -- the Datum Transformation Tool How VDatum Works Examples Outcomes and Future Work

4
What is a Datum? Two related definitions of “datum” Idealization
“A set of constants defining a coordinate system” Realization “The constants, the coordinate system, and all points and lines that have been consistently determined by measurement and computation”

5
Datums Arise From Relative Measurements, I
25 20 15 10 10.0 5.0 5 5.0 0.0 Datum A

6
Datums Arise From Relative Measurements, II
20 15 10.0 10 5.0 5 0.0 0.0 -5 -10 Datum B

7
Datums Arise From Relative Measurements, III
20 25 15 10.0 20 10 5.0 15 5 10 10.0 0.0 0.0 5.0 5 5.0 -5 0.0 -10 Datum A Datum B Note: Discontinuity between A & B

8
When Datums Match Datum A (All elevations are now consistent) 25 20 15
20.0 20 15.0 15 10.0 10 10.0 10.0 5.0 5 5.0 0.0 Datum A (All elevations are now consistent)
")
9
Shoreline/Datum Problem, I
MSL MLLW N N 15 3 meters meters Mean Lower Low Water (MLLW) Mean Sea Level (MSL)
 Mean Sea Level. (MSL)")
10
Shoreline/Datum Problem, II
A shoreline has a vertical datum imbedded in it If you change a shoreline vertical reference -- It will cause translations in the shoreline It will also change the shape of the shoreline As with all geo-referenced data, only combine data in a common datum

11
Shoreline and Legal Issues

12
Vertical Datums - 3 Categories
Tidal Datums Related to particular stages of ocean tide Mean Lower Low Water (MLLW) Mean Sea Level (MSL) Orthometric Datums Related to equipotential surface of the Earth North American Vertical Datum (NAVD 88) Ellipsoidal (3-D) Datums Related to an ellipsoidal figure of the Earth Heights directly from GPS North American Datum 1983 (NAD 83)
 Mean Sea Level (MSL) Orthometric Datums. Related to equipotential surface of the Earth. North American Vertical Datum 1988 (NAVD 88) Ellipsoidal (3-D) Datums. Related to an ellipsoidal figure of the Earth. Heights directly from GPS. North American Datum 1983 (NAD 83)")
13
Ellipsoidal (3-D) Datums
NAD 83 Control Point WGS 84 ~2-meter shift Differences in origins cause differences in height above the ellipsoid

14
Orthometric Datums NGVD US (5 Canada) fixed tide gauges NAVD fixed tide gauge The adopted control points and constants defining the heights cause NGVD 29 and NAVD 88 to differ by up to 2.2 meters

15
Tide Datums Tide datum references are extracted from tidal measurements Mean Low Water Mean Lower Low Water

16
Tides Vary Globally Tide ranges in feet
Cape Town Dakar Le Havre Southampton Bremerhaven Causes differences in the tidal datums

17
Various Tidal/Sounding Datums
Approximate Lowest Astronomical Tide Approximate Mean Low Water Springs Approximate Mean Low Water Tide Approximate Mean Low Water Approximate Mean Sea Level Equinoctial Spring Low Water Highest Astronomical Tide Higher High Water Large Tide Highest Normal High Water Higher High Water Highest High Water High Water High Water Springs International Great Lakes Datum 1985 Indian Spring High Water Indian Spring Low Water Lowest Astronomical Tide Lower Low Water Large Tide Lowest Low Water Springs Lower Low Water Lowest Low Water Low Water Low Water Springs Mean Higher High Water Mean Higher Water Mean High Water Mean High Water Neaps Mean High Water Springs Mean Lower Low Water Springs Mean Lower Low Water Mean Low Water Mean Low Water Neaps Mean Low Water Springs Mean Sea Level Mean Tide Level Nearly Lowest Low Water Neap Tide Spring Tide

18
The Vertical Datum Problem
A sizable number of vertical datums Several versions in each of 3 categories Topographic data in NAVD 88 or NGVD 29 Hydrographic data in MLW and MLLW Newest technology referenced with GPS (NAD 83, WGS84, or ITRF) Need a tool to transform between vertical datums
 Need a tool to transform between vertical datums.")
19
VDatum Java application -- Windows-like graphics
Transform heights and soundings between vertical datums 2 modes -- interactive and batch Uses regional datum transformation grids Supports 26 different vertical datums

20
VDatum -- Interactive Mode

21
VDatum -- Batch Mode

22
VDatum -- Batch Input Data

23
VDatum -- Batch Output Data

24
Vertical Datums in VDatum
Tidal MHHW MHW DTL MTL LMSL MLW MLLW Orthometric NAVD 88 NGVD 29 Ellipsoidal NAD 83 (86) WGS 84 (G873) WGS 84 (G730) WGS 84 (original) WGS 72 ITRF97 ITRF96 ITRF94 ITRF93 and 8 more ...
 WGS 84 (G873) WGS 84 (G730) WGS 84 (original) WGS 72. ITRF97. ITRF96. ITRF94. ITRF93. and 8 more ...")
25
The Datum Transformation Constellation
MLLW WGS 84 (G873) ITRF88 LMSL ITRF96 NEOS 90 ITRF93 MTL ITRF91 ITRF97 WGS 84 (G730) NAVD 88 SIO/MIT 92 DTL MLW MHHW ITRF94 ITRF92 WGS 84 (orig.) PNEOS 90 ITRF89 NGVD 29 NAD 83 (86) ITRF90 MHW How many paths ???
 ITRF88. LMSL. ITRF96. NEOS 90. ITRF93. MTL. ITRF91. ITRF97. WGS 84 (G730) NAVD 88. SIO/MIT 92. DTL. MLW. MHHW. ITRF94. ITRF92. WGS 84 (orig.) PNEOS 90. ITRF89. NGVD 29. NAD 83 (86) ITRF90. MHW. How many paths")
26
The Datum Transformation Roadmap, I
WGS 84 (G873) WGS 84 (G730) MHHW WGS 84 (orig.) ITRF97 MHW ITRF96 NGVD 29 ITRF94 MTL ITRF93 NAD 83 (86) NAVD 88 LMSL ITRF92 ITRF91 DTL ITRF90 ITRF89 MLW ITRF88 SIO/MIT 92 NEOS 90 MLLW PNEOS 90 Each edge is a transformation.
 WGS 84 (G730) MHHW. WGS 84 (orig.) ITRF97. MHW. ITRF96. NGVD 29. ITRF94. MTL. ITRF93. NAD 83 (86) NAVD 88. LMSL. ITRF92. ITRF91. DTL. ITRF90. ITRF89. MLW. ITRF88. SIO/MIT 92. NEOS 90. MLLW. PNEOS 90. Each edge is a transformation.")
27
The Datum Transformation Roadmap, II
WGS 84 (G873) WGS 84 (G730) MHHW WGS 84 (orig.) ITRF97 MHW ITRF96 NGVD 29 ITRF94 MTL ITRF93 NAD 83 (86) NAVD 88 LMSL ITRF92 ITRF91 DTL ITRF90 ITRF89 MLW ITRF88 SIO/MIT 92 NAD 83 (86) WGS 84 (G873) feet NAVD LMSL MLLW NEOS 90 MLLW PNEOS 90
 WGS 84 (G730) MHHW. WGS 84 (orig.) ITRF97. MHW. ITRF96. NGVD 29. ITRF94. MTL. ITRF93. NAD 83 (86) NAVD 88. LMSL. ITRF92. ITRF91. DTL. ITRF90. ITRF89. MLW. ITRF88. SIO/MIT 92. NAD 83 (86) WGS 84 (G873) feet. NAVD LMSL MLLW NEOS 90. MLLW. PNEOS 90.")
28
Tidal Datum Maps Figure portrays MSL - MLLW (meters)
Produced by a calibrated and verified hydrodynamic model of Tampa Bay Digital maps were made for 7 tidal datums

31
Tidal Benchmark Data Geodetic level ties to tidal benchmarks allow evaluation of tide models and calibration of local mean sea level variations.

32
Integrated Bathy/Topo Model
USGS Topography NOAA Bathymetry

33
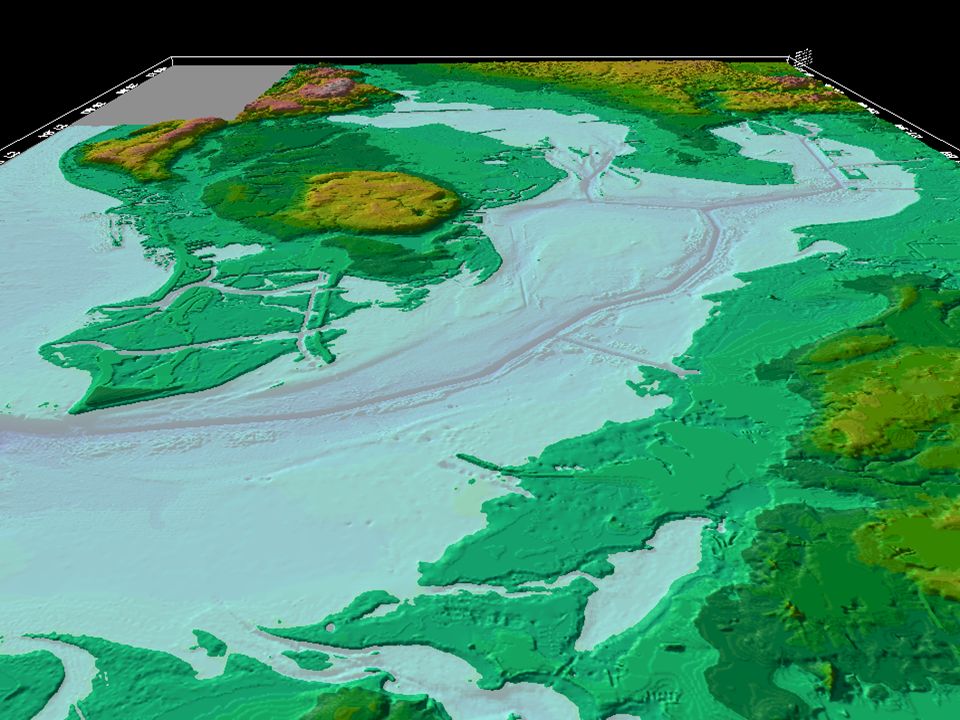
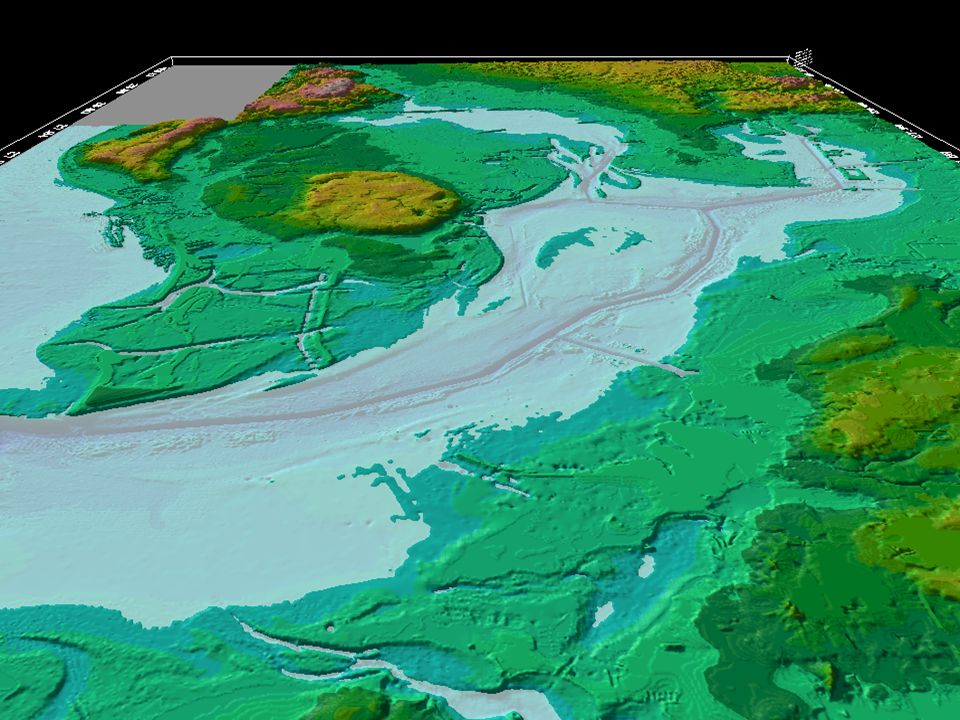
3-D Visualization of Bathy/Topo DEM
(Visualizations are useful, but the form in which the actual data are provided to the coastal marine user is also critical.)
")
36
Outcomes Transformation tool for integration of diverse datasets
Portable implementation Can be imbedded in GIS software systems Validated against geodetic control Leveled benchmarks GPS control points Tide gauges Easy to use User can focus on the data, not on the geodesy

37
Future Work and More Outcomes
Extend to cover entire US coastline Accuracy maps for the transformations Support decision process for data acquisition legacy data -- perhaps less accurate new GPS-based data -- through transformation Intersect various vertical reference planes through a seamless 3-D bathy/topo surface Potential to establish shorelines with new technology and with accuracy equivalent to that of photogrammetry

39
Backup Slides

46
Tampa Bay Bathy/Topo/Shoreline Demonstration Project
Mapping the Land-Sea Interface A Collaborative Approach

47
Tampa Bay Demonstration Project
Bathy/Topo Digital Elevation Model (DEM) NOAA bathymetric data (referenced to the ellipsoid) USGS topographic data (referenced to the ellipsoid) Datum Transformation Tool (26 ortho, 3-D, and tidal datums) geographic distribution of tidal datums from hydrodynamic model incorporation of recent hi-res 3rd-party data (datums, standards) recent hi-res shorelines from airborne and satellite remote sensing internally consistent shorelines (HW, MSL, MLLW) from a DEM with a high-resolution shoreline elevation zone GIS compatibility (with retention of maximum resolution) Website-accessible, with tutorials and standards append other data sets (e.g., demographics, environmental, etc.) first steps towards a “National Shoreline”
 NOAA bathymetric data (referenced to the ellipsoid) USGS topographic data (referenced to the ellipsoid) Datum Transformation Tool (26 ortho, 3-D, and tidal datums) geographic distribution of tidal datums from hydrodynamic model. incorporation of recent hi-res 3rd-party data (datums, standards) recent hi-res shorelines from airborne and satellite remote sensing. internally consistent shorelines (HW, MSL, MLLW) from a DEM with a high-resolution shoreline elevation zone. GIS compatibility (with retention of maximum resolution) Website-accessible, with tutorials and standards. append other data sets (e.g., demographics, environmental, etc.) first steps towards a National Shoreline")
48
The problems that motivated this project
Inconsistency between NOAA and USGS shorelines referenced to different tidal datums differences in measurement instruments and procedures CONFUSED MARINE USER COMMUNITY (for many purposes, consistency is more important than accuracy) (plus, need to minimize the duplication of effort between the two agencies) (plus, need to find the most-cost effective way to map 95,000 miles of coastline in the U.S.) Sparse and outdated bathymetric and topographic data AND, no national framework to allow the inclusion of recent high-resolution data from other sources (state, county, academic) (And thus) a geospatial reference frame for other coastal data sets that is less consistent and accurate than is needed Limits our ability to accurately represent the coastal zone and predict impacts on communities and the environment hurricane evacuation planning -- local, state, and national boundaries habitat restoration -- electronic navigational chart systems permitting
 (plus, need to minimize the duplication of effort between the two agencies) (plus, need to find the most-cost effective way to map 95,000 miles of coastline in the U.S.) Sparse and outdated bathymetric and topographic data. AND, no national framework to allow the inclusion of recent high-resolution data from other sources (state, county, academic) (And thus) a geospatial reference frame for other coastal data sets that is less consistent and accurate than is needed. Limits our ability to accurately represent the coastal zone and predict impacts on communities and the environment. hurricane evacuation planning -- local, state, and national boundaries. habitat restoration -- electronic navigational chart systems. permitting.")
49
Where is the Shoreline? NOAA Shoreline USGS Topo Sheet
Spin 2 satellite imagery

50
Just 3 of the 26 Datums handled by the Datum Transformation Tool
Allows transformation to a common datum for the blending of different data sets.

51
Except for around the navigation channels, the bathymetric data
is from the 1950s. The original topographic data is also primarily from the 1950s, with some 1960s and early 1970s data. Need to be able to take advantage of other data sources.

52
Learning How to Obtain High-Resolution Up-to-Date
Shoreline from various Airborne and Satellite Techniques In addition to the April 1999 airborne photogrammetry and the SPIN2 satellite data, shoreline data sets will be derived (and inter-compared) from: airborne lidar data, airborne hyperspectral data, IKONOS satellite data, SAR data, and SHOALS (bathymetric lidar) data. How to cost-effectively map 95,000 miles of U.S. coastline?
 from: airborne lidar data, airborne hyperspectral data, IKONOS satellite. data, SAR data, and SHOALS (bathymetric. lidar) data. How to cost-effectively map. 95,000 miles of U.S. coastline")
53
The only way to accomplish all this is through A Collaborative Approach
USGS and NOAA working together to solve complex mapping issues on the front end State and local needs, and participation Working with Federal Emergency Management Agency (FEMA) and U.S. Army Corp of Engineers (USACE) Local Partners include (so far): Florida Marine Research Institute Tampa Bay National Estuary Program Rookery Bay National Estuarine Research Reserve Ports
 and U.S. Army Corp of Engineers (USACE) Local Partners include (so far): Florida Marine Research Institute. Tampa Bay National Estuary Program. Rookery Bay National Estuarine Research Reserve. Ports.")
54
Dennis Milbert, Ph.D. Kurt Hess, Ph.D. National Ocean Service, NOAA
Combination of Topography and Bathymetry Through Application of Calibrated Vertical Datum Transformations in the Tampa Bay Region Dennis Milbert, Ph.D. Kurt Hess, Ph.D. National Ocean Service, NOAA

55
Introduction What is a Datum? When Datums Don’t Match
The Shoreline/Datum Problem Categories of Datums VDatum -- the Datum Transformation Tool Examples in Tampa Bay Outcomes and Future Work

Similar presentations


TOOLS TO OBTAIN GEODETIC CONTROL.>")


 and the Defense Mapping School Reviewed by:____________ Date:_________ Objective:>")


