Download presentation
Presentation is loading. Please wait.

2
Definition Finding groups of objects such that the objects in a group will be similar (or related) to one another and different from (or unrelated to) the objects in other groups Inter-cluster distances are maximized Intra-cluster distances are minimized
 to one another and different from (or unrelated to) the objects in other groups Inter-cluster distances are maximized Intra-cluster distances are minimized")
3
Applications Group related documents for browsing Group genes and proteins that have similar functionality Group stocks with similar price fluctuations Reduce the size of large data sets Group users with similar buying mentalities

4
Clustering is ambiguous There is no correct or incorrect solution for clustering. How many clusters? Four ClustersTwo Clusters Six Clusters

5
Challenges faced Scalability Ability to deal with different types of attributes Noise & Outliers Complex shapes and types of data Incremental clustering and insensitivity to the order of input records High dimensionality Constraint-based clustering Interpretability and usability

6
Types of Data Data Matrix n-objects with p-variables. The structure is in the form of a relational table, or n x p matrix Dissimilarity Matrix object-by-object structure. Stores a collection of proximities that are available for all pair of n objects. d(i, j) is the dissimilarity between objects i and j. d(i, j) = d(j, i) and d(i, i) = 0
 is the dissimilarity between objects i and j. d(i, j) = d(j, i) and d(i, i) = 0.")
7
Types of Data Interval- Scaled Variables Binary Variables Nominal Ordinal Ratio-Scaled variables Variables of Mixed Types

8
Interval- Scaled Variables

9
Interval-scaled variables contd…

10
Binary variables Binary variable has only two states 0 and 1 Dissimilarity between two binary variables is by a 2*2 contingency table for binary variables 10 1qrq+r 0sts+t q+sr+tp OBJ i OBJ j

11
Dissimilarity between binary variables NameGenderFeverCoughTest-1Test-2Test-3Test-4 JackMYNPNNN MaryFYNPNPN JimMYYNNNN D(Jack,Mary)=0.33 D(Jack,Jim)=0.67 D(Mary,Jim)=0.75
=0.33 D(Jack,Jim)=0.67 D(Mary,Jim)=0.75")
12
Categorical Variables

13
Ordinal similar to nominal variables, but values are ordered in some sequence. Eg. rank or employees can be assistant, associate, full Ratio-Scaled variables Makes a positive measurement on a non-linear scale Eg. Growth of bacteria, radioactivity Variables of Mixed Types Other types of data

14
Types of clustering Hierarchical clustering(BIRCH) A set of nested clusters organized as a hierarchical tree Partitional Clustering(k-means,k-mediods) A division data objects into non-overlapping (distinct) subsets (i.e., clusters) such that each data object is in exactly one subset Density – Based(DBSCAN) Based on density functions Grid-Based(STING) Based on nultiple-level granularity structure Model-Based(SOM) Hypothesize a model for each of the clusters and find the best fit of the data to the given model
 A set of nested clusters organized as a hierarchical tree Partitional Clustering(k-means,k-mediods) A division data objects into non-overlapping (distinct) subsets (i.e., clusters) such that each data object is in exactly one subset Density – Based(DBSCAN) Based on density functions Grid-Based(STING) Based on nultiple-level granularity structure Model-Based(SOM) Hypothesize a model for each of the clusters and find the best fit of the data to the given model")
15
Partitional Clustering Original PointsA Partitional Clustering

16
Hierarchical Clustering Traditional Hierarchical Clustering Non-traditional Hierarchical Clustering Traditional Dendrogram Non-traditional Dendrogram

17
Clustering Algorithms Partitional K-means K-mediods Hierarchial Agglomerative Divisive

18
K-Mean Algorithm Each cluster is represented by the mean value of the objects in the cluster Input: set of objects (n), no of clusters (k) Output: set of k clusters Algo Randomly select k samples & mark them a initial cluster Repeat Assign/ reassign in sample to any given cluster to which it is most similar depending upon the mean of the cluster Update the cluster’s mean until No Change.
, no of clusters (k) Output: set of k clusters Algo Randomly select k samples & mark them a initial cluster Repeat Assign/ reassign in sample to any given cluster to which it is most similar depending upon the mean of the cluster Update the cluster’s mean until No Change.")
19
K-Means (Array) Step 1:Randomly assign objects to k clusters Step 2:Find the mean of each cluster Step 3:Re-assign objects to the cluster with closest mean. Step 4:Go to step2 Repeat until no change.

20
Example 1 Given: {2,3,6,8,9,12,15,18,22} Assume k=3. Solution: Randomly partition given data set: K1 = 2,8,15mean = 8.3 K2 = 3,9,18mean = 10 K3 = 6,12,22mean = 13.3 Reassign K1 = 2,3,6,8,9mean = 5.6 K2 = mean = 0 K3 = 12,15,18,22mean = 16.75

21
Reassign K1 = 3,6,8,9mean = 6.5 K2 = 2mean = 2 K3 = 12,15,18,22mean = 16.75 Reassign K1 = 6,8,9mean = 7.6 K2 = 2,3mean = 2.5 K3 = 12,15,18,22mean = 16.75 Reassign K1 = 6,8,9mean = 7.6 K2 = 2,3mean = 2.5 K3 = 12,15,18,22mean = 16.75 STOP

22
Example 2 Given {2,4,10,12,3,20,30,11,25} Assume k=2. Solution: K1 = 2,3,4,10,11,12 K2 = 20, 25, 30

23
Advantages K-means is relatively scalable and efficient in processing large data sets The computational complexity of the algorithm is O(nkt) n: the total number of objects k: the number of clusters t: the number of iterations Normally: k<<n and t<<n Disadvantage Can be applied only when the mean of a cluster is defined Users need to specify k K-means is not suitable for discovering clusters with non convex shapes or clusters of very different size It is sensitive to noise and outlier data points (can influence the mean value)
 n: the total number of objects k: the number of clusters t: the number of iterations Normally: k<<n and t<<n Disadvantage Can be applied only when the mean of a cluster is defined Users need to specify k K-means is not suitable for discovering clusters with non convex shapes or clusters of very different size It is sensitive to noise and outlier data points (can influence the mean value)")
24
K-Means (graph) Step1: Form k centroids, randomly Step2: Calculate distance between centroids and each object Use Euclidean’s law do determine min distance: d(A,B) = (x 2 -x 1 ) 2 + (y 2 -y 1 ) 2 Step3: Assign objects based on min distance to k clusters Step4: Calculate centroid of each cluster using C =(x 1 +x 2 +…x n, y 1 +y 2 +…y n ) n n Go to step 2. Repeat until no change in centroids.

25
Example 1 There are four types of medicines and each have two attributes, as shown below. Find a way to group them into 2 groups based on their features. MedicineWeightpH A11 B21 C43 D54

26
Solution Plot the values on a graph. Mark any k centeroids

27
Calculate Euclidean distance of each point from the centeroids. D = 013.615 102.834.24 Based on minimum distance, we assign points to clusters:K1 = A K2 = B, C, D Calculate new centeroids C = 2+4+5,1+3+4=(11/3, 8/3) 3 3
 3 3.")
28
Marking the new centroids Continue the iteration, until there is no change in the centroids or clusters.

29
Final solution

30
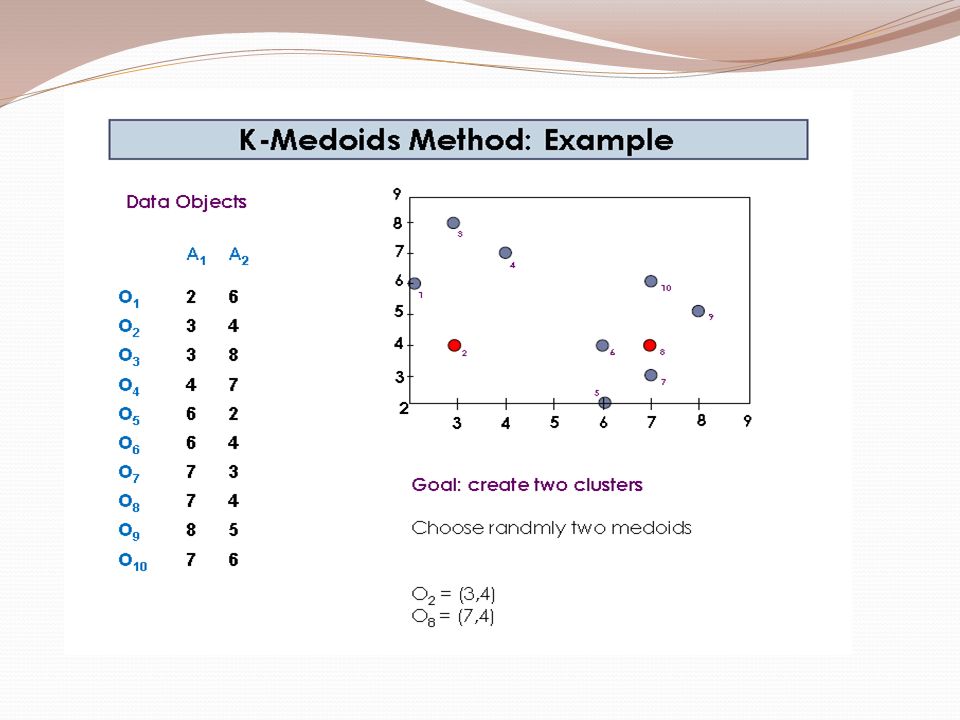
Example 2 Use K-means algorithm to create two clusters. Given:

31
Example 3. Group the below points into 3 clusters

45
Agglomerative Step1:Make each object as a cluster Step2:Calculate the Euclidean distance from every point to every other point. i.e., construct a Distance Matrix Step3:Identify two clusters with shortest distance. Merge them Go to Step 2 Repeat until all objects are in one cluster

46
Example Find single link technique to find clusters in the given database. XY 1 0.40.53 2 0.220.38 3 0.350.32 4 0.260.19 5 0.080.41 6 0.450.3

47
Plot given data

48
Construct a distance matrix 10 20.240 30.220.150 40.370.200.150 50.340.140.280.290 60.230.250.110.220.390 123456

49
Identify two nearest clusters

50
Repeat process until all objects in same cluster

51
Dendogram

52
Single Link Min distance matrix

53
Complete link Max distance matrix

54
Average link Average distance matrix

55
Use below data and draw single link, complete link and average link dendogram. ObjectXY A22 B32 C11 D31 E1.50.5

Similar presentations


 to one another and different from (or.>")

