Download presentation
Presentation is loading. Please wait.

1
Maps & North Carolina

2
What are modern maps? Modern maps are often created with a computer program and satellites. It is known as GPS (global positioning system) and GIS (geographic information systems). GPS locates your position or point on a map. GIS is layers of info stored to create a map of an area.
 and GIS (geographic information systems). GPS locates your position or point on a map. GIS is layers of info stored to create a map of an area.")
3
GPS & GIS

4
What are soil maps? Soil map is a map showing diversity of soil types and/or soil properties (soil pH, textures, organic matter, depths of horizons etc.) in the area of interest. Soil maps are most commonly used for land evaluation, spatial planning, agricultural extension, environmental protection and similar projects
 in the area of interest. Soil maps are most commonly used for land evaluation, spatial planning, agricultural extension, environmental protection and similar projects.")
5
Soils of North Carolina
North Carolina is broken into four major soil types: (mountain, piedmont, inner coastal plain and outer coastal plain). We live in the outer coastal plain. Each of the major soil types have different soils based on the rock and mineral composition of the area. However the soils are similar and have many of the same characteristics.
. We live in the outer coastal plain. Each of the major soil types have different soils based on the rock and mineral composition of the area. However the soils are similar and have many of the same characteristics.")
6
Soil Map of North Carolina

7
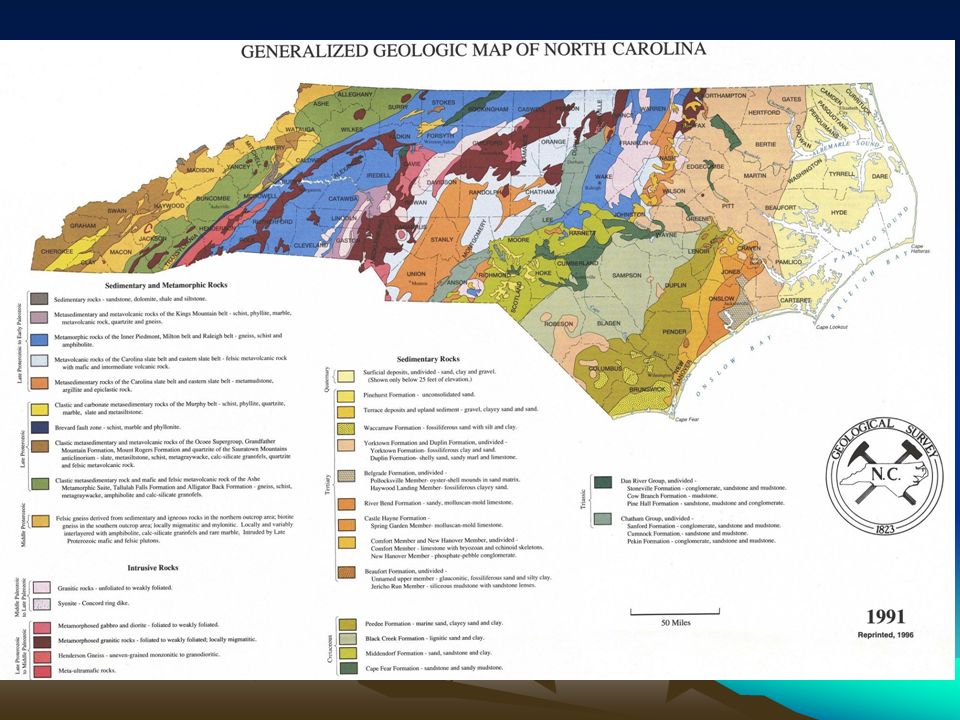
What are geological maps?
A geologic map or geological map is a special-purpose map made to show geological features. Rock units or geologic strata are shown by color or symbols to indicate where they are exposed at the surface.

8
Geological Map of N. Carolina Questions.
When you look at the geological map of North Carolina on the next slide answer the following questions. What do you notice about the time frame of the rock formations? What does this time frame indicate about eastern NC? How would this have impacted the rest of the eastern seaboard?

10
North Carolina Past and Present
North Carolina Past and Present. Why our geological map looks like it does. Mountain Region. The Appalachian Mountain range in western NC first formed around 480 million years ago when the continents were colliding. The pictures shows the collision and separation of continents.

11
Piedmont Soil After the formation of the Appalachian Mountains, the mountains began to be weathered by natural forces and the material moved down the slope to what is known now as the Piedmont region.

12
Coastal Region The Atlantic Ocean began to form around 130 million years ago when Pangea broke apart. Around 150, ,000 years ago the sea level reached towards Raleigh. Meaning the eastern seaboard was underwater. This means that our soil was washed away and more recently created than the rest of the state’s soil.

13
What are topographic maps?
Topographic maps—are maps that show surface features (topography) of the Earth. Topographic maps use lines known as contour lines to indicate the elevation of the Earth’s surface on the map.
 of the Earth. Topographic maps use lines known as contour lines to indicate the elevation of the Earth’s surface on the map.")
14
Topographic Map

15
How do you calculate contour interval?
You must locate two index contours. Then you must subtract the two numbers. Count the number of contour lines between the two numbers. Then divide the subtracted number by the number of contour intervals to determine contour interval.

16
Map usage. Topographic maps and geological maps can be used to locate fault lines, plate boundaries and various clues to helping us understand how the Earth was and is being shaped. Maps are constantly changing because the Earth is constantly undergoing change from the forces that act upon it. EX: Himalayan Mountains are constantly growing as the plates continue to collide into one another. Sea level is rising around 1cm a year, not enough for us to notice but over 100s to 1000s of year we will begin to notice and have to make corrections. Constant volcanic eruptions creating new volcanic mountains. The list goes on and on. Just remember the Earth and its landforms are ever changing and so are the maps that represent them.

Similar presentations