Download presentation
Presentation is loading. Please wait.

1
Basic Biology for Bioinformatics: genes as information The central dogma of molecular genetics DNA to RNA to protein to phenotype Protein functions, synthesis and structure RNA synthesis and processing DNA replication Basics of transmission genetics Note: many of the figures used in this presentation are copyrighted. Most are taken from "Genetics: From Genes to Genomes" by Hartwell and colleagues (McGraw Hill)
.")
2
Biology for bioinformatics: Alignment of pairs of sequences Multiple sequence alignment Prediction of RNA secondary structure Phylogenetic prediction Database searching for sequences Gene prediction Analysis of microarray expression data Protein classification Protein folding / structure prediction Genome analysis / databases Genetic variation (haplotypes and allelic association)
")
4
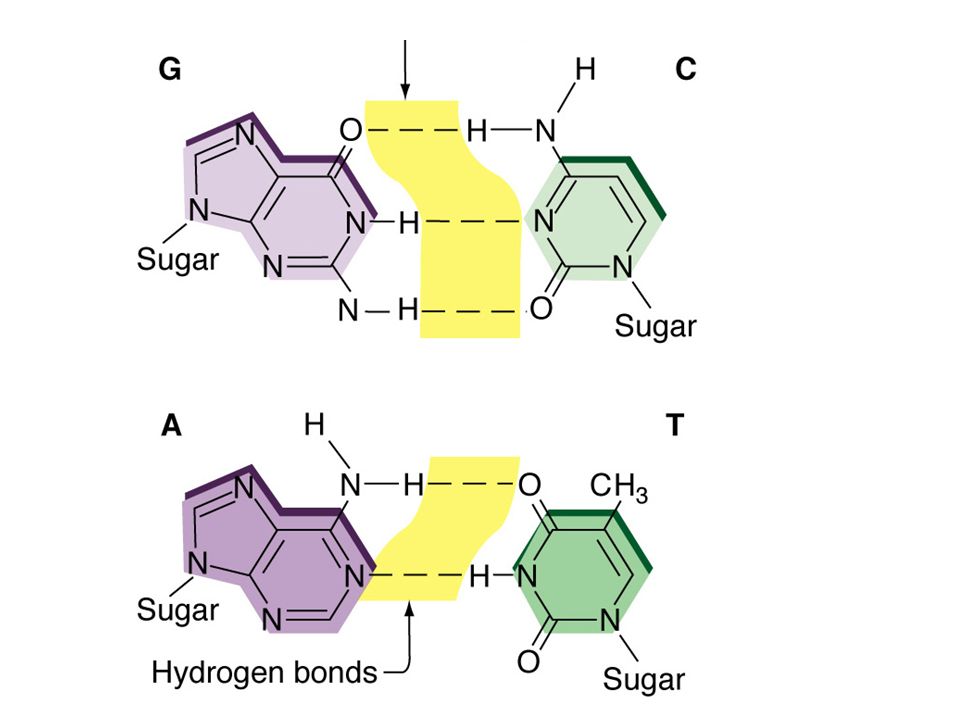
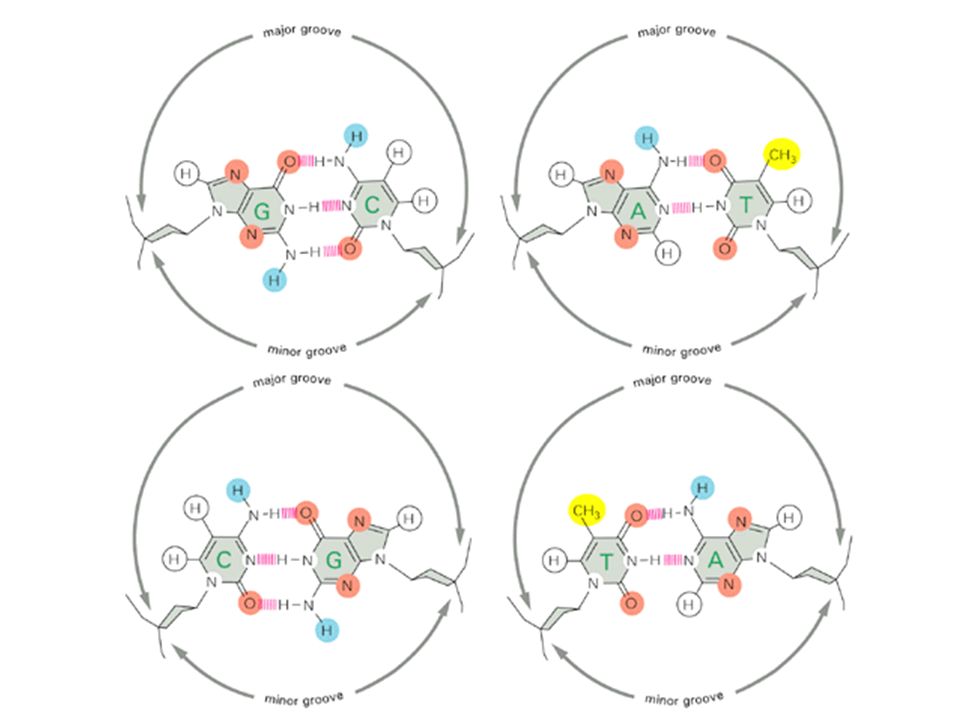
What is it about DNA that allows it to carry information?

8
DNA polymerase Alberts et al. Fig. 6-36

9
Molecular genetics: genes as information DNA -> RNA -> protein. DNA is digital information. Each nucleotide carries 2 bits of information. Implications Low-error propagation. Complete representation in digital databases. Aquisition of genetic information is the raw fuel behind the explosion of bioinformatics

10
Clelland et al. Nature 399:533. Hiding messages in DNA microdots.

11
"For it is not cell nuclei, not even individual chromosomes, but certain parts of certain chromsomes from certain cells that must be isolated and collected in enormous quantities for analysis; that would be the precondition for placing the chemist in such a position as would allow him to analyze [the hereditary material] more minutely than the morphologists." - Theodor Boveri 1904 If the information in DNA is contained in single molecules, how can we know about it? We reduce the complexity of the DNA by amplification and use the power of complementarity to detect specific sequences by hybridization. Determination of the chromosomal location of TGx in the human genome by fluorescent in situ hybridization. (from Daniel Aeschlimann's web site (Univ. of Wales) http://www.uwcm.ac.uk/study/dentistry/bds/staff/aeschlimann.htm
![For it is not cell nuclei, not even individual chromosomes, but certain parts of certain chromsomes from certain cells that must be isolated and collected in enormous quantities for analysis; that would be the precondition for placing the chemist in such a position as would allow him to analyze [the hereditary material] more minutely than the morphologists. - Theodor Boveri 1904 If the information in DNA is contained in single molecules, how can we know about it.](http://images.slideplayer.com/27/9120223/slides/slide_11.jpg "We reduce the complexity of the DNA by amplification and use the power of complementarity to detect specific sequences by hybridization. Determination of the chromosomal location of TGx in the human genome by fluorescent in situ hybridization. (from Daniel Aeschlimann s web site (Univ. of Wales)")
12
from Konstantin V. Krutovskii and David B. Neale 2001 "Forest Genomics for Conserving Adaptive Genetic Diversity" Microarrays Array Scan Visualize Analyze

13
Photolithographic arrays (Affymetrix) from www.affymetrix.com Each spot has an oligo with a distinct sequence
 from Each spot has an oligo with a distinct sequence")
14
Homologous proteins conserve elements of genetic information (sequence).
.")
15
New gene functions can arise from pre-existing gene functions

16
Related genes retain sequence similarity.

17
DNA to RNA to protein to phenotype Proteins: enzymes alkaptonuria phenylketonuria phenylalanine buildup in the brain can cause mental retardation

18
DNA to RNA to protein to phenotype Proteins: regulators

19
DNA to RNA to protein to phenotype Structural proteins Ehlers-Danlos syndrome (joint hypermobility) is one of the phenotypes associated with mutations in genes encoding collagen.
 is one of the phenotypes associated with mutations in genes encoding collagen.")
20
DNA to RNA to protein to phenotype Proteins What do they do? see http://www.ncbi.nlm.nih.gov/cgi-bin/COG/palox?fun=all

21
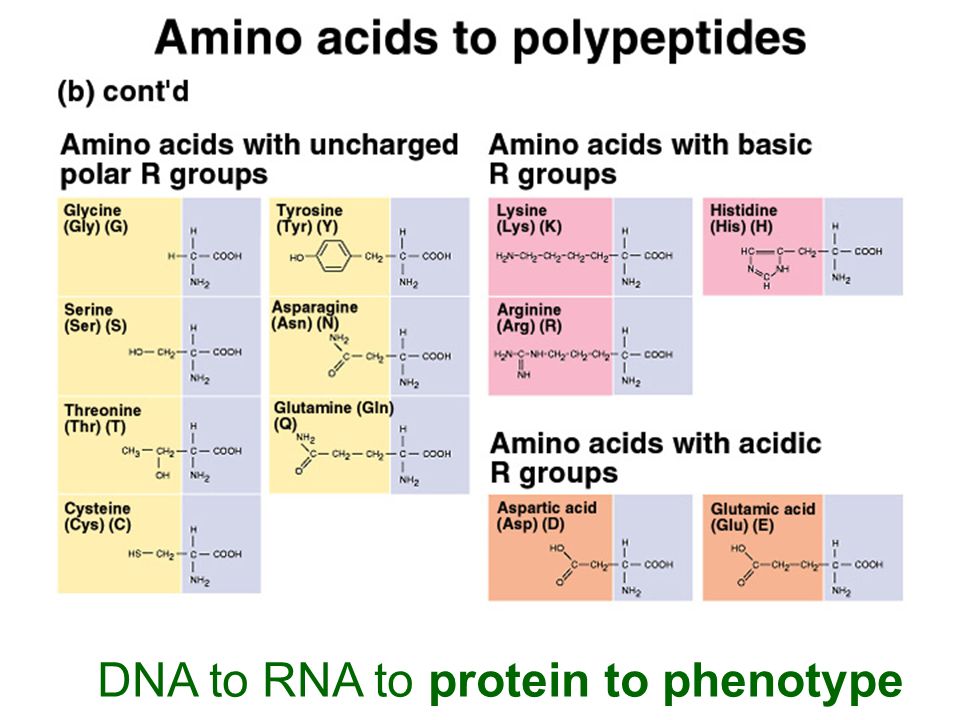
DNA to RNA to protein to phenotype

22
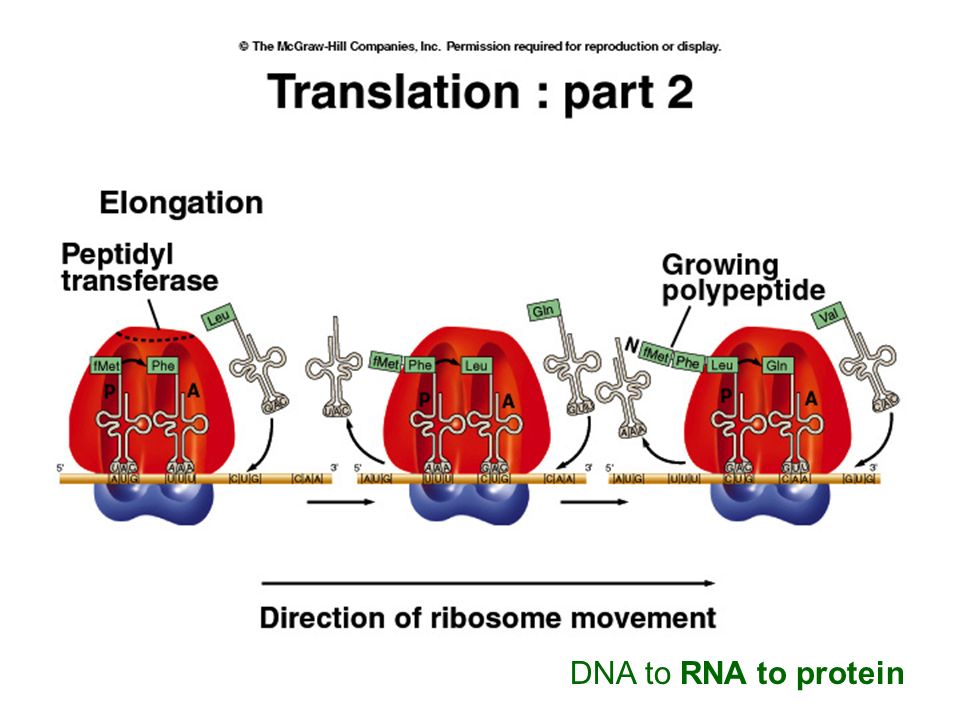
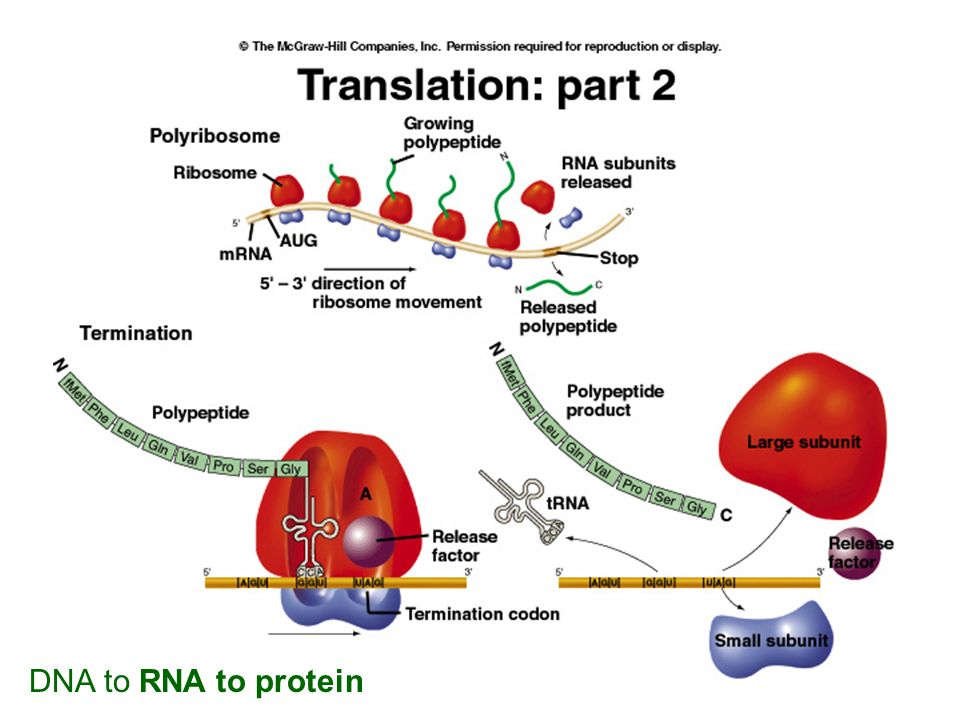
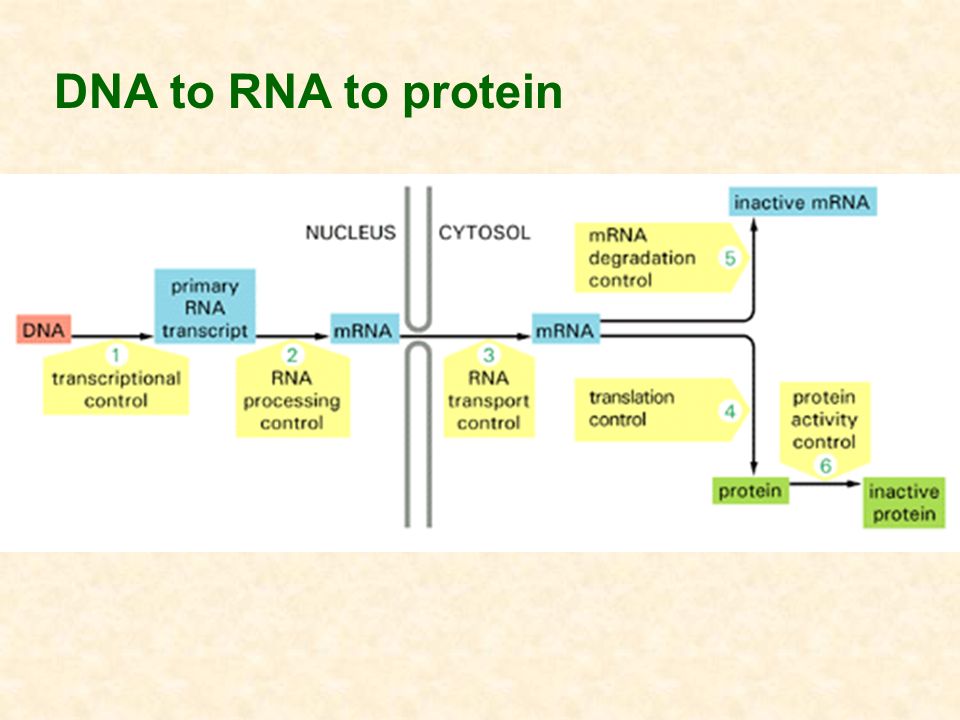
DNA to RNA to protein

25
DNA to RNA to protein to phenotype

27
protein Hydrogen bonds within the protein and the rigidity of the peptide bond are critical determinants of protein structure.

28
DNA to RNA to protein to phenotype Molecular Biology of the Cell. 1994. Figure 3-30 -helix

29
DNA to RNA to protein to phenotype Molecular Biology of the Cell. 1994. Figure 3-29 ß-sheet

30
NCBI provides information about proteins

31
GenBank flat file format for HA oxidase

32
GenBank fasta file format for HA oxidase

33
Links to other information about HA oxidase

34
The HA oxidase gene and its flanking region on chromosome 3q21

35
OMIM: Alkaptonuria is caused by mutations in HA oxidase

36
Conserved Domains

37
Three-dimensional structure of the protein, if known, can be viewed.

38
Lectures 8 and 35 will cover types of mutation in detail

39
Gene density in selected genomes SpeciesGenome size Gene #Ave. Size (Mb.) Eschericia coli4.74,3001.1 kb. Saccharomyces cerevisiae12.16,0002.0 kb. C. elegans9716,0006.0 kb. Arabidopsis11525,5004.5 kb. Drosophila melanogaster120 13,6008.8 kb. Homo sapiens3,20075,000 ?40.0 kb. 30,000100.0 kb. CDS (coding sequence) sizes do not vary much at all, between 1.3 and 1.5 kb.
 Eschericia coli4.74, kb. Saccharomyces cerevisiae12.16, kb. C. elegans9716, kb. Arabidopsis11525, kb. Drosophila melanogaster120 13, kb. Homo sapiens3,20075, kb. 30, kb. CDS (coding sequence) sizes do not vary much at all, between 1.3 and 1.5 kb..")
40
What's in the genome besides genes: introns

41
What's in the genome besides genes: remote regulatory DNA

42
DNA to RNA to protein to phenotype Lecture 14 will cover transcription in detail

43
DNA to RNA to protein to phenotype

44
DNA to RNA to protein

45
DNA to RNA

46
DNA to RNA to protein

49
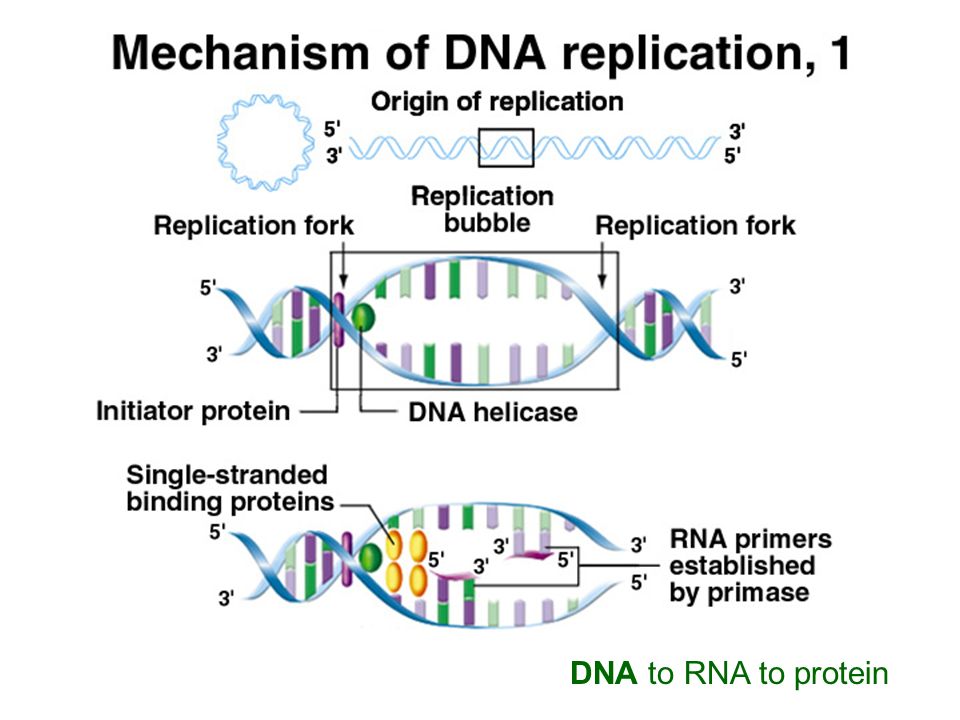
DNA must be maintained. Natural processes can degrade the information in the DNA

50
Molecular Biology of the Cell, third edition, panel 1-1 Cells and organelles

51
4C 46 chromosomes each with 2 duplexes 4C 92 chromosomes 2C 46 chromosomes per cell

52
Mitosis: heterozygosity is maintained

53
Meiosis results in new combinations of alleles

54
Mendel's laws of segregation and independent assortment come from meiosis

55
A A a a a a a a A A A A B B b b b b b b B B B B

56
Recombination A A a a B b B b A A B b A A B b a a B b a a B b

57
Measuring rates of recombination.

62
Formal definition of linkage disequilibrium If two loci have alleles A 1, A 2 with frequencies p 1, p 2 and B 1, B 2 with frequencies q 1, q 2, there are four possible haplotypes (A 1 B 1, A 1 B 2, A 2 B 1, and A 2 B 2 ). Let these frequencies be f 1,1, f 1,2, f 2,1, f 2.2. If there is no linkage disequilibrium, then f 1,1 = p 1 q 1, f 1,2 = p 1 q 2, and so on. There are a number of measures of linkage disequilibrium. One of them is D = f 1,1 f 2.2 - f 1,2 f 2.1.

63
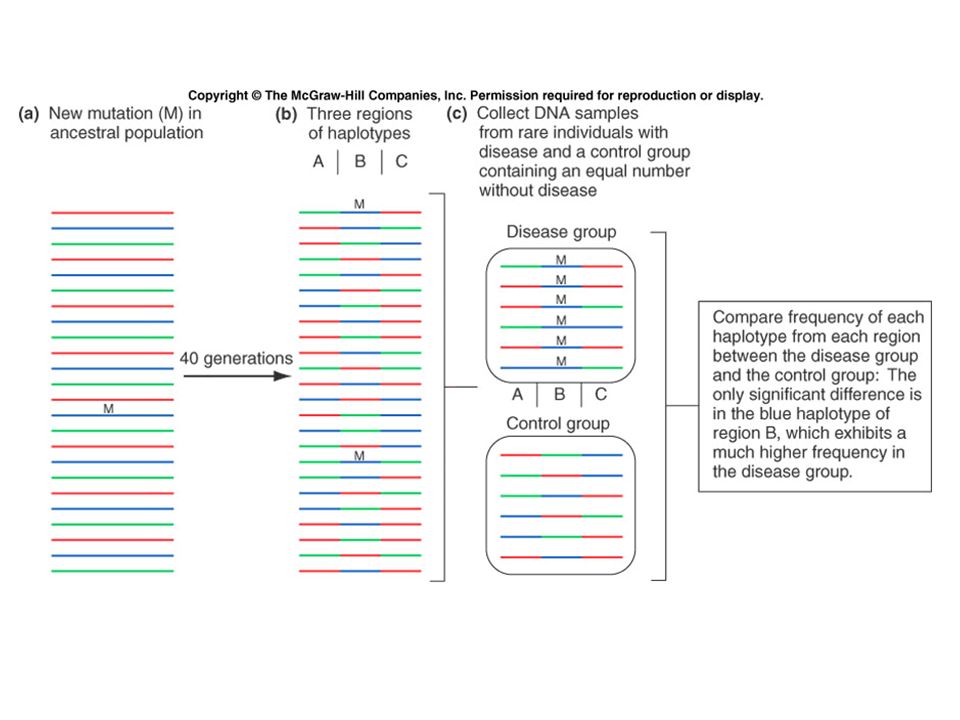
Interpreting allelic association The general case is described by an isolated population that has high frequencies (p and r respectively) of both a disease-causing allele D 1 and an unlinked marker M 1. The descendents of people who move from that population to a second population with different frequencies will show association between D 1 and M 1 even though they are not linked. p =.02, r =.5 p =.0001 r =.1 The disease-causing allele is at a high frequency in a small village. Affected people in a nearby city are more likely to have other alleles, such as M 1, that are found in elevated frequencies in that village merely because they have ancestors from that village.

64
Biology for bioinformatics: Alignment of pairs of sequences Multiple sequence alignment Prediction of RNA secondary structure Phylogenetic prediction Database searching for sequences Gene prediction Analysis of microarray expression data Protein classification Protein folding / structure prediction Genome analysis / databases Genetic variation (haplotypes and allelic association)
")
65
Next time: more about the status of those problems and current state of the art methods. Tutorial II: Monday, May 10, 2118 CSIC, 2:00 - 3:45

Similar presentations


 Department of Biomedical Informatics Ohio State University.>")


