Download presentation
Presentation is loading. Please wait.

1
Bringing Together the Social and Technical in Big Data Analytics: Why You Can't Predict the Flu from Twitter, and Here's How David A. Broniatowski Asst. Prof. EMSE http://www.seas.gwu.edu/~broniatowski

2
PUBLIC HEALTH CYCLE PopulationDoctors Surveillance Intervention

3
Traditional mechanisms Surveys Clinical visits REQUIRES: DATA ON THE POPULATION This has limited research

4
TWITTER Short messages (140 chars) posted to public internet Content: news, conversation, pointless babble Huge volume 500 million a day
 posted to public internet Content: news, conversation, pointless babble Huge volume 500 million a day")
5
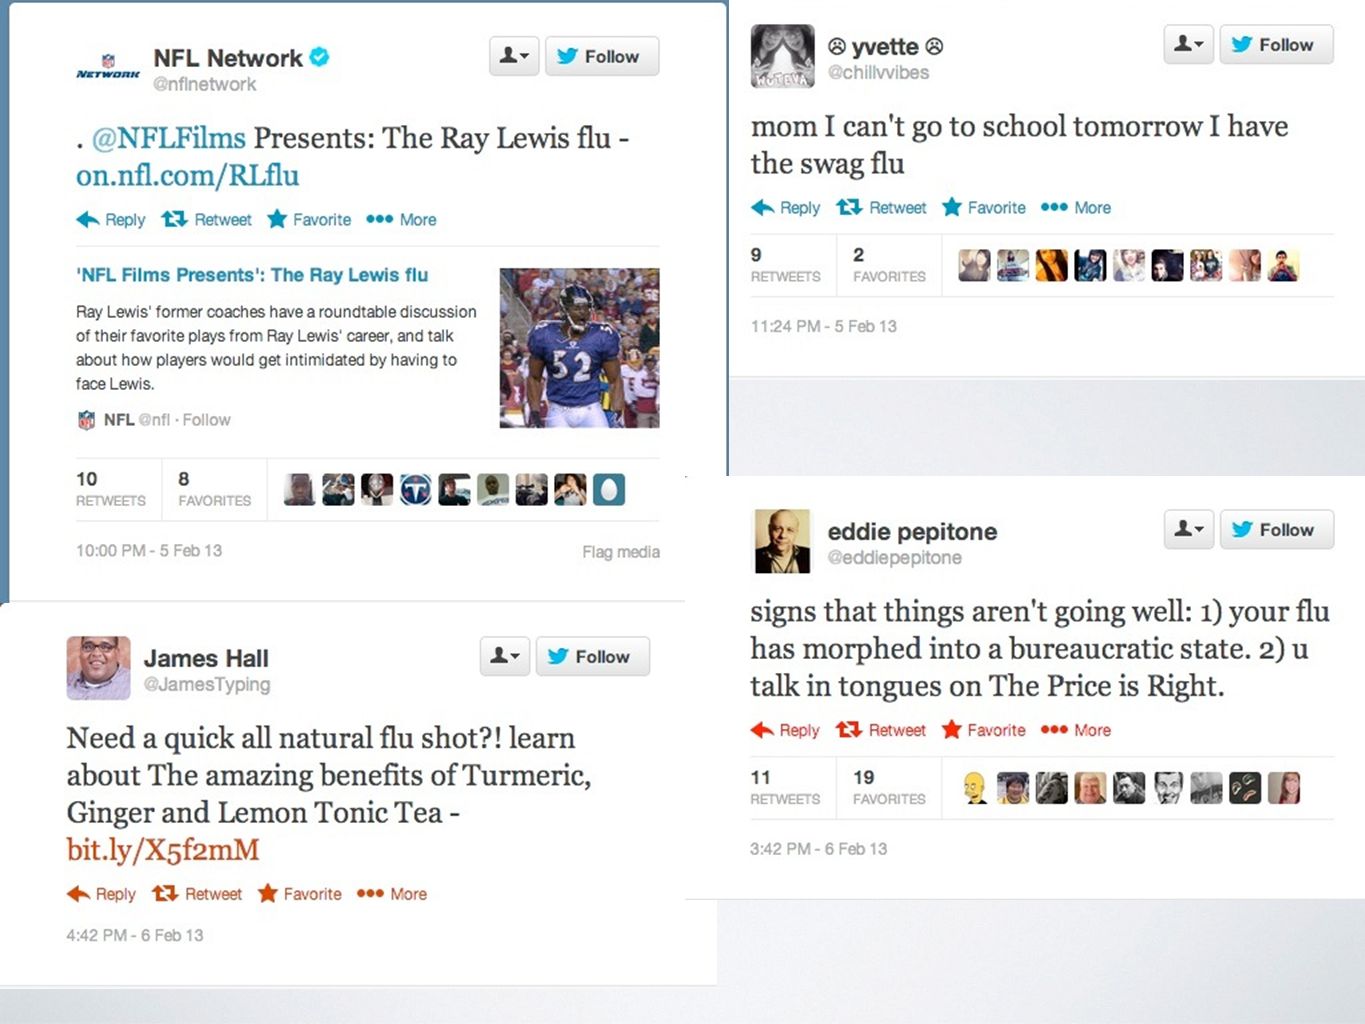
WHY TWITTER? Huge volumes of data A constant stream of small updates Nothing like waiting in line to buy cigarettes behind a guy in a business suit buying gasoline with ten dollars in dimes I eat pizza too much I'm at Cvs Pharmacy (117th and kendall, Miami)
.")
6
INFLUENZA SURVEILLANCE

7
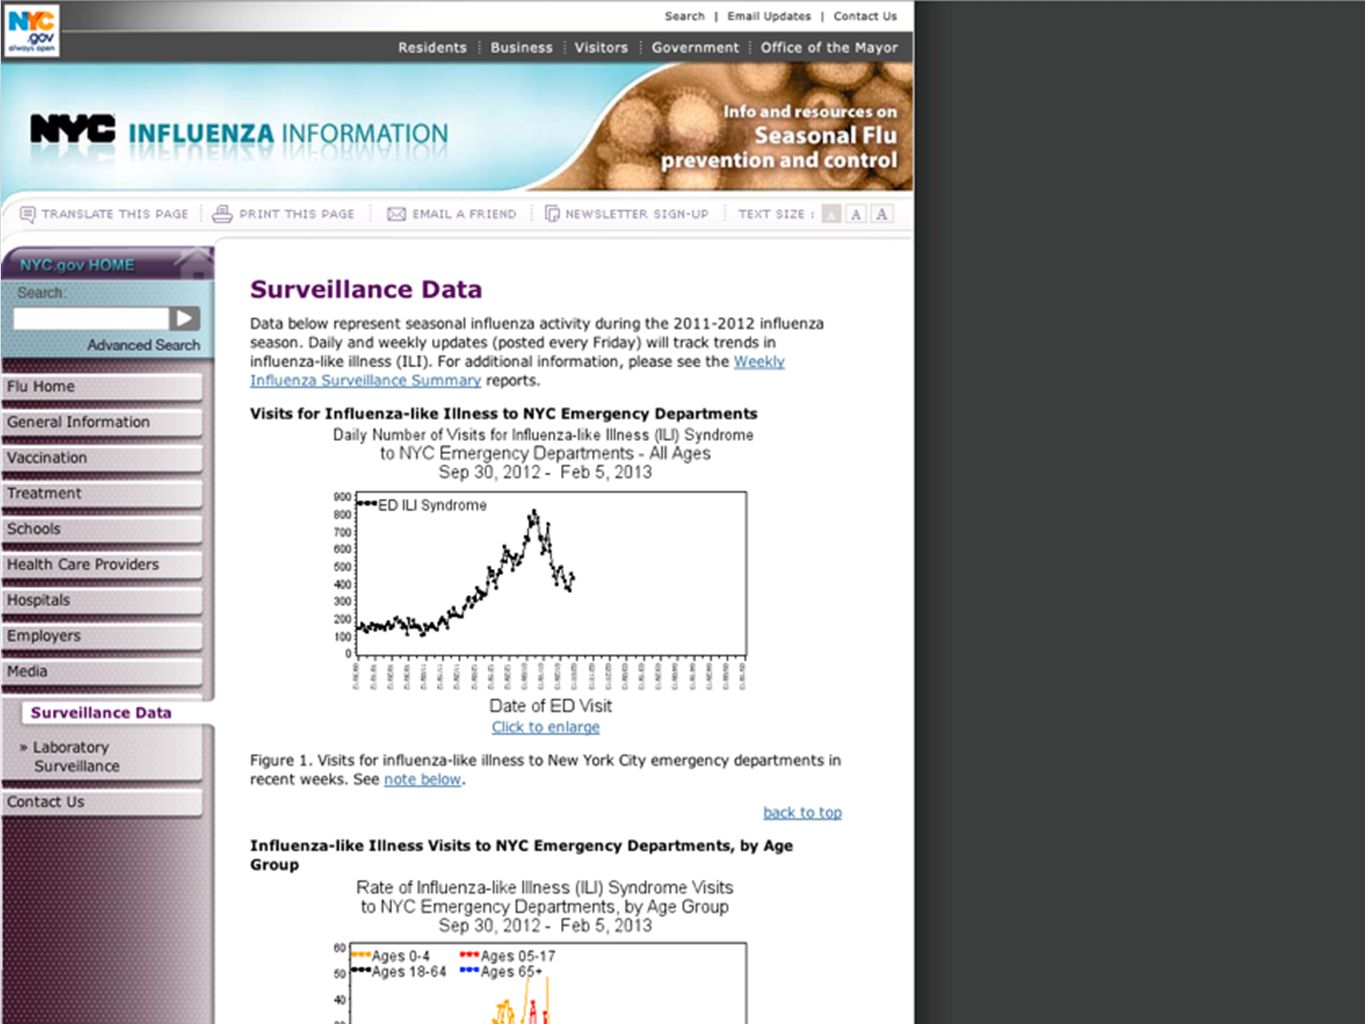
CDC has nationwide surveillance network with 2700 outpatient centers reporting ILI: influenza-like illness Cons: Slow (2 weeks) Varying levels of geographic granularity
 Varying levels of geographic granularity")
8
TWITTER SURVEILLANCE Twitter influenza surveillance must be 1) Accurately track ground truth Identify infection tweets 2) Effective at both municipal and national level Expand tweet geolocation and evaluate municipal accuracy 3) Predictive in real time Deploy previously trained system on this flu season
 Accurately track ground truth Identify infection tweets 2) Effective at both municipal and national level Expand tweet geolocation and evaluate municipal accuracy 3) Predictive in real time Deploy previously trained system on this flu season")
11
PIPELINE CLASSIFIERS Three steps using supervised machine learning+NLP Step 1: Identify health tweets Step 2: Identify flu related Step 3: Awareness vs. infection

12
TWITTER SURVEILLANCE Twitter influenza surveillance must be 1) Accurately track ground truth Identify infection tweets 2) Effective at both municipal and national level Expand tweet geolocation and evaluate municipal accuracy 3) Predictive in real time Deploy previously trained system on this flu season
 Accurately track ground truth Identify infection tweets 2) Effective at both municipal and national level Expand tweet geolocation and evaluate municipal accuracy 3) Predictive in real time Deploy previously trained system on this flu season")
13
LOCAL EFFECTIVENESS Current work focuses on US national flu rates Useful surveillance needed by region/state/city How can Twitter track local trends? Is it accurate? Is there enough data? Only about 1% of Twitter is geocoded

15
CARMEN (Dredze et al., 2013) Over 4000 known locations (countries, states, counties, cities) Geocordinates only: ~1% Expanded locations: ~22% Available in Python and Java
 Over 4000 known locations (countries, states, counties, cities) Geocordinates only: ~1% Expanded locations: ~22% Available in Python and Java")
16
TWITTER SURVEILLANCE Twitter influenza surveillance must be 1) Accurately track ground truth Identify infection tweets 2) Effective at both municipal and national level Expand tweet geolocation and evaluate municipal accuracy 3) Predictive in real time Deploy previously trained system on this flu season
 Accurately track ground truth Identify infection tweets 2) Effective at both municipal and national level Expand tweet geolocation and evaluate municipal accuracy 3) Predictive in real time Deploy previously trained system on this flu season")
17
SURVEILLANCE RESULTS Pearson Correlation 20092011 Keywords0.970.646 Flu Classifier0.970.519 Google Flu Trends 0.970.897 Infection0.9720.7832

18
GOOGLE FLU TRENDS GETS IT WRONG? Lohr, S. (2014). Google flu trends: the limits of big data. New York Times.

19
Pearson Correlation: Keywords: 0.75 Infection: 0.93

21
ILI counts: Infection: 0.88 Keywords: 0.72 BLIND EVALUATION

22
2013-2014 0.95 Correlation

24
MOST RECENT DATA Broniatowski, D. A., Dredze, M., Paul, M. J., & Dugas, A. (2015). Using Social Media to Perform Local Influenza Surveillance in an Inner-City Hospital: A Retrospective Observational Study. JMIR Public Health and Surveillance, 1(1), e5.
. Using Social Media to Perform Local Influenza Surveillance in an Inner-City Hospital: A Retrospective Observational Study. JMIR Public Health and Surveillance, 1(1), e5..")
25
PREDICTING ACTUAL FLU IN BALTIMORE Broniatowski, D. A., Dredze, M., Paul, M. J., & Dugas, A. (2015). Using Social Media to Perform Local Influenza Surveillance in an Inner-City Hospital: A Retrospective Observational Study. JMIR Public Health and Surveillance, 1(1), e5.
. Using Social Media to Perform Local Influenza Surveillance in an Inner-City Hospital: A Retrospective Observational Study. JMIR Public Health and Surveillance, 1(1), e5..")
26
HEALTHTWEETS.ORG

27
HEALTHTWEETS WORLDWIDE

28
Some Other Projects David A. Broniatowski Asst. Prof. EMSE http://www.seas.gwu.edu/~broniatowski

29
29 BIG DATA FOR GROUP DECISION MAKING: EXTRACTING SOCIAL NETWORKS FROM FDA ADVISORY PANEL MEETING TRANSCRIPTS (Broniatowski & Magee, 2013 American Journal of Therapeutics; Broniatowski & Magee, 2012 IEEE Signal Processing Magazine; Broniatowski & Magee, in preparation)
")
30
“GERMS ARE GERMS” AND “WHY NOT TAKE A RISK?” MODELS AND DATA FOR RISKY DECISION MAKING IN THE ED (Broniatowski, Klein, & Reyna, in press, Medical Decision Making Broniatowski & Reyna, in preparation)
")
31
Examples: Phylogenetic trees General Motors Problem decomposition Tree HierarchyLayered Hierarchy Examples: Levels of abstraction Law firm organization Problem abstraction Grid Networks and Teams Examples: Contagion Markets Crowdsourcing Families (teams) HOW DO WE DESIGN SYSTEMS TO USE INFORMATION FLOW TO OUR ADVANTAGE? We would like to deepen our intuition regarding system architectures (Broniatowski & Moses, in preparation)
.")
32
32 QUESTIONS? Big data Influenza tracking and coupled contagion Group decision-making Individual decision-making Formal models Medical and engineering applications Formal and mathematical models Systems architecture Design for flexibility broniatowski@gwu.edu

Similar presentations


 Surveillance Methods Robin M. Williams, Nebraska Department of Health & Human Services/University.>")


