Download presentation
Presentation is loading. Please wait.

2
TerraPop Mission Enabling research, learning, and policy analysis by providing integrated spatiotemporal data describing people and their environment.

3
TerraPop Partners

4
Source Data

5
Data Formats across Domains Microdata: Characteristics of individuals and households Area-level data: Characteristics of places defined by boundaries Raster data: Values tied to spatial coordinates

6
Census Data – Temporal Depth

7
Census Data – Geographic Granularity

8
Environmental Data Land Use & Land Cover MODIS Land Cover 2001-2012 Global Land Cover 2000 Harvested Area and Yield for 175 crops Climate Annual bioclimatic variables derived from CRU- TS Long-term average temperature and precipitation

9
MICRODATA AREA-LEVEL RASTER Location-Based Integration

10
Microdata Area-level data Rasters Mix and match variables originating in any of the data structures Obtain output in the data structure most useful to you

11
Location-Based Integration Individuals and households with their environmental and social context Microdata Area-level data Rasters

12
Location-Based Integration Summarized environmental and population County ID G17003100001 G17003100002 G17003100003 G17003100004 G17003100005 G17003100006 G17003100007 County ID Mean Ann. Temp. Max. Ann. Precip. G1700310000121.2768 G1700310000223.4589 G1700310000324.3867 G1700310000421.5943 G1700310000524.1867 G1700310000624.4697 G1700310000725.6701 County ID Avg. Ann. Temp. Avg. Ann. Precip. Rent, Rural Rent, Urban Own, Rural Own, Urban G1700310000121.276831291063637365 G1700310000223.4589294910751469717 G1700310000324.3867341815891108617 G1700310000421.59431882425202142 G1700310000524.18672416572426197 G1700310000624.46972560934950563 G1700310000725.67012126653321215 characteristics for administrative districts Microdata Area-level data Rasters

13
Location-Based Integration Rasters of population and environment data Microdata Area-level data Rasters

14
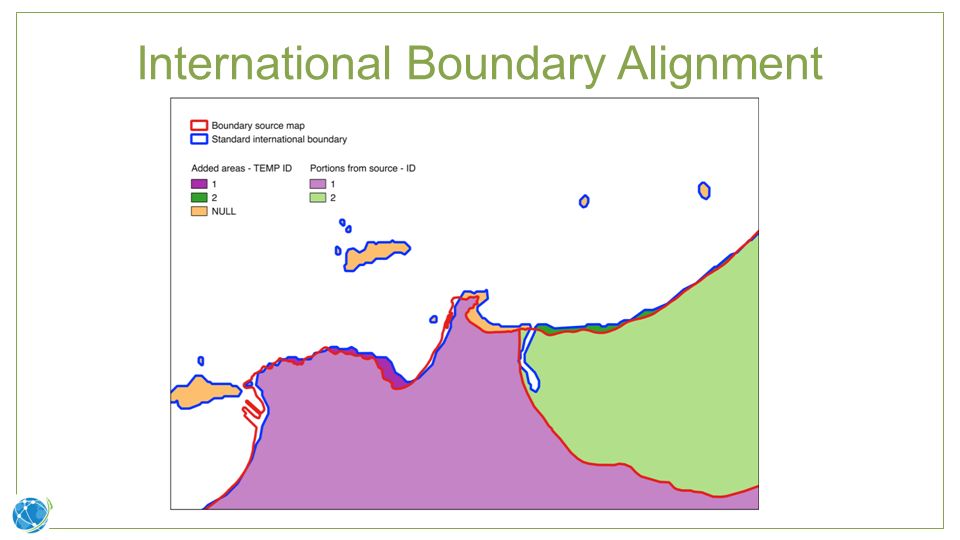
Boundaries are Key Linkages across data formats rely on administrative unit boundaries Containers for summarizing raster data to area-level data Containers for distributing area-level data to raster cells Codes link area-level and summarized raster data to microdata Sets of units and codes must match census data

15
1. Source data 2. Align boundaries 3. Match codes 4. Historical adjustments 5. Harmonize and regionalize Boundary Processing

16
Source Shapefiles NameProducer Global Administrative Areas (GADM)UC-Berkeley/IRRI/Museum of Vertebrate Zoology Global Administrative Units Layers (GAUL)United Nations Second Administrative Level Boundaries (SALB)United Nations National Statistics and Mapping Agenciesvaries
UC-Berkeley/IRRI/Museum of Vertebrate Zoology Global Administrative Units Layers (GAUL)United Nations Second Administrative Level Boundaries (SALB)United Nations National Statistics and Mapping Agenciesvaries")
17
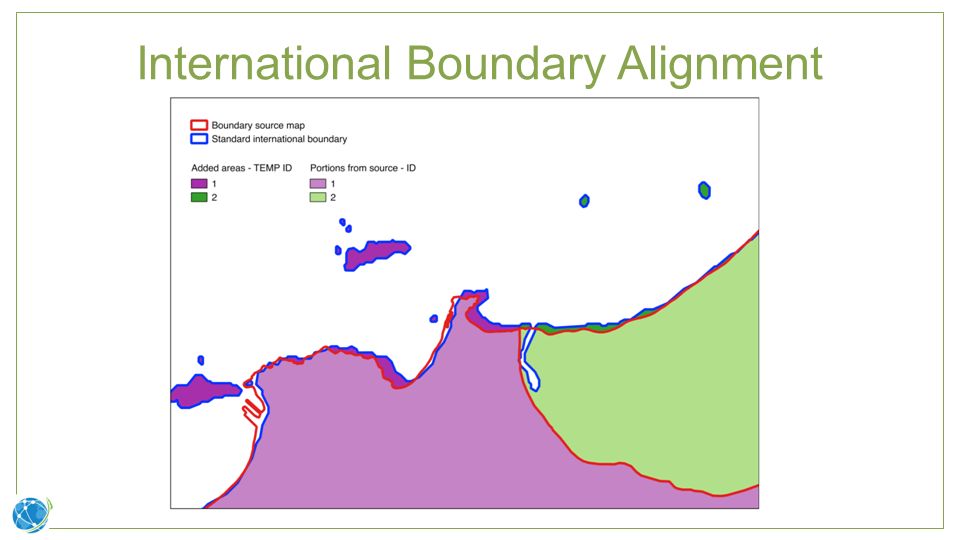
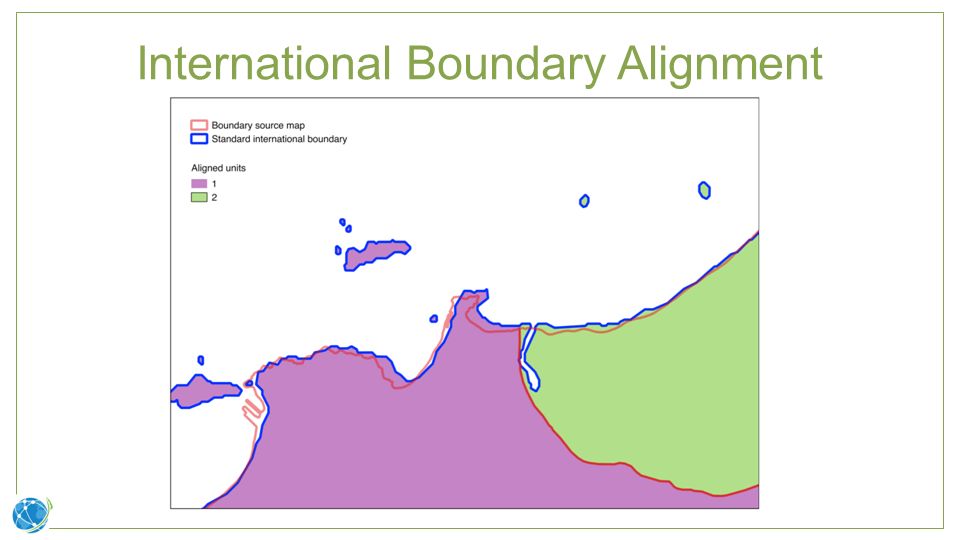
International Boundary Alignment

21
NameCode Ariquemes11012 Cabixi11013 Cacoal11014 Code Matching LabelCandidate Codes Cacoa l Census data names & codes Shapefile attribute table 11014 Find name in table of census data names/codes Look up census data code and insert in shapefile Edit to fix mismatches Run check to identify remaining issues Use checking script for historical data

22
Photographed Countries Census Bureau Library, Library of Congress, Harvard

23
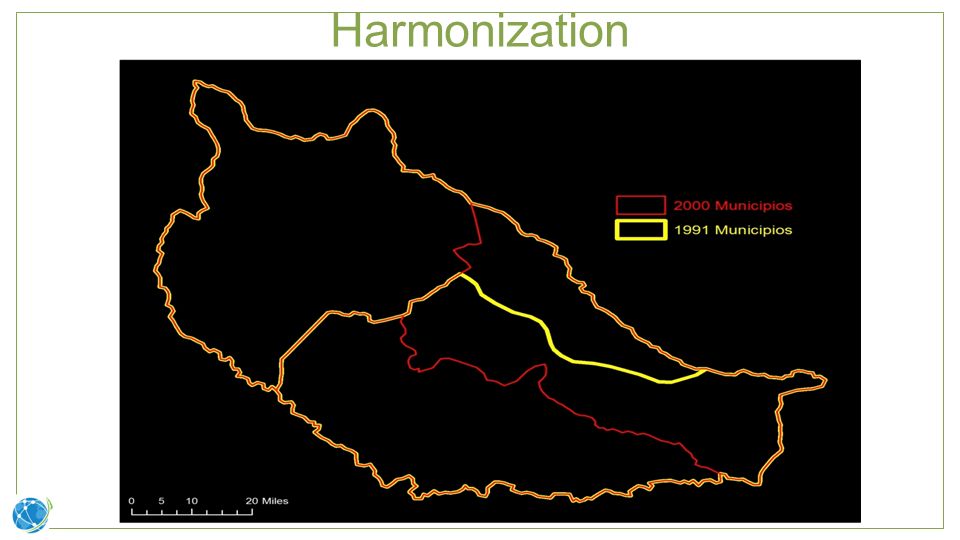
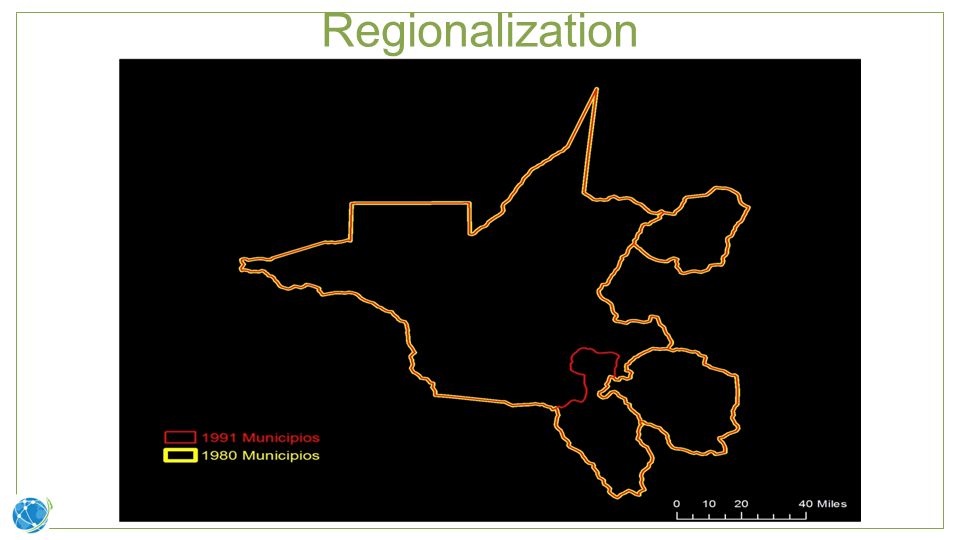
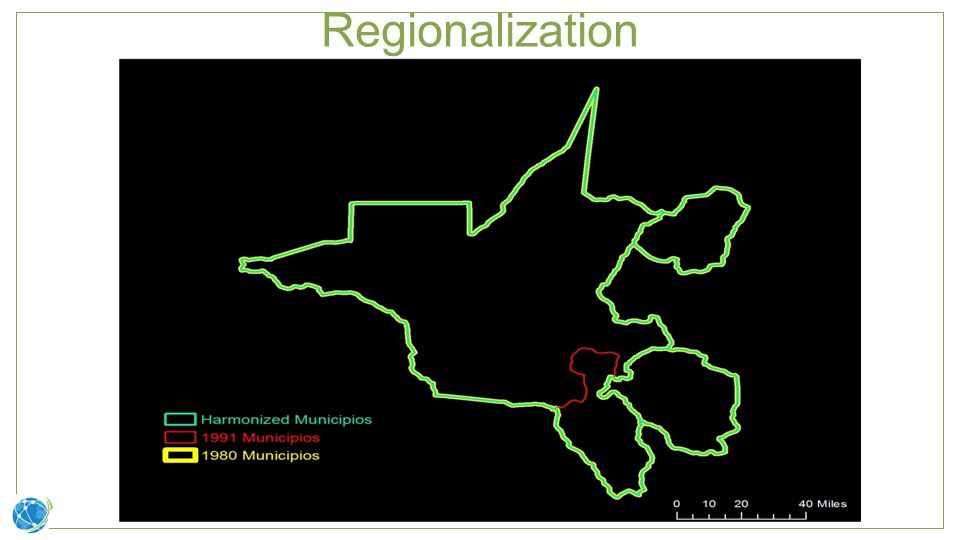
Harmonization & Regionalization Temporal aggregation Harmonized – Consistent footprint over time via minimal aggregation Year-specific – Not harmonized Minimum population aggregation Regionalized – Neighboring units combined to meet minimum population threshold (typically 20,000) Base – Not regionalized
 Base – Not regionalized")
24
Extract Builder TerraClip Data Access

25
Contact USER SUPPORT: TERRAPOP@UMN.EDUTERRAPOP@UMN.EDU TWITTER: @TERRAPOP

27
Future Additions Aggregate census data Historical data (48 countries) Variables in addition to population by sex (65 countries) Gridded Population of the World Environmental data CRU monthly time series – precipitation & temperature Vegetation characteristics – NDVI, greenness Elevation and derived characteristics Soils Species distribution
 Variables in addition to population by sex (65 countries) Gridded Population of the World Environmental data CRU monthly time series – precipitation & temperature Vegetation characteristics – NDVI, greenness Elevation and derived characteristics Soils Species distribution")
28
Harmonization

31
Regionalization

34
Population < 20,000

35
Year-Specific Regionalized Population > 20,000

Similar presentations


 Vrije Universiteit - Amsterdam.>")


 $7,571 in 2001 $212,040 in 1991 $3,796,800 in 1981 $56,168,800 in 1971 $1,233,179,000.>")


