Download presentation
Presentation is loading. Please wait.

1
Marketing of Timber -- Context and Procedures

2
Components of Hardwood Market

3
Economic Background

4
Time Periods Short-run – all factors (shifters) are held constant, only P and Q change. Long-run – all factors can shift, defining new relationships between P and Q. –At any given price the quantity of stumpage can change because of factors other than price.

5
Timber Demand Specify a time period, usually one year, and a group of buyers, then Timber demand is the quantities of stumpage that the group would purchase for harvesting at different prices $/MBF MBF/yearQ P Market demand curve for short-run, i.e. all “shifters” held constant

6
Derived Demand for Timber P Lu = $300 P lo = $200 D Lumber D Logs D Stumpage Milling & distribution cost = $100/MBF Logging & hauling cost = $70/MBF Q (log scale) Q It starts with D Lumber and D Logs and D Stumpage are derived from D Lumber Start with lumber and work back- ward to stumpage
 Q It starts with D Lumber and D Logs and D Stumpage are derived from D Lumber Start with lumber and work back- ward to stumpage")
7
Stumpage Supply as a Flow Flow supply is based on the “flow” of stumpage at a given price, quantity that would actually be sold. Stock supply is timber inventory in the market area specified, only a small portion of which is actually available at prevailing market prices.

8
Stock Compared to Flow for Indiana Sawtimber volume was 17.1 bil. bd. ft. (Doyle) in 1998 (Stock supply) Sawtimber harvest of industrial roundwood was 367 mil. bd. ft. in 2000 (Flow supply) Flow was 2.1% of stock
 in 1998 (Stock supply) Sawtimber harvest of industrial roundwood was 367 mil. bd. ft. in 2000 (Flow supply) Flow was 2.1% of stock.")
9
Price Elasticities of Log Market High Quality Average Quality Demand1.11.2 Supply1.31.5

10
Removals are for 2000 and inventories are for 1998

11
Doesn’t reflect recent increase in removals Based on average growth and removals from 1986 to 1997

12
Timber Supply Specify a time period, usually one year, and a group of sellers, then Timber supply is the quantities of stumpage that forest owners would sell for harvest at different stumpage prices $/MBF MBF/year Q P S Stumpage

13
Supply of Stumpage Determines Supply of Lumber 300 $/MBF 200 130 S Lu S Lo S Milling & distribution cost = $100/MBF Logging & hauling cost = $70/MBF Q MBF/year log scale Start with stumpage and work backward to lumber

14
Timber Supply as Aggregate of Individual Supply Curves 100 50150 500 100200 150300 S stumpB for timber owner Bob S stumpJ for timber owner Jane $/MBF MBF log scale Price of $100/MBF Price of $500/MBF S stumpT total stumpage supply curve For a given price sum quantities horizontally

15
Competition from Stumpage Buyer’s Perspective Highly competitive stumpage market –Small mill is price taker –Large mill Monopsonist – one buyer Oligopsonist – very few buyers MBF $/MBF E ps > 1 elastic MBF $/MBF E ps < 1 inelastic SsSs SsSs

16
Short-Run Equilibrium 300 $/MBF 200 130 S Lu S Lo S Q MBF/year log scale D Lu D Lo DSDS

17
Price Elasticities for Stumpage Market High QualityAverage Quality Demand0.850.82 Supply1.0

18
Indiana Industrial Roundwood Production - Intl. ¼-inch log rule 1980198419901995 Sawlogs 347,861353,509435,808353,150 Veneer logs 10,73814,17716,76523,670 Cooperage 8,1533,9495,1561,834 Other 8,5027,4226,8350 All products 375,254379,057464,564378,654

19
Hardwood Lumber Industry is Consolidating

20
Industrial roundwood receipts by Indiana mills, Doyle log scale (Piva and Gallion, 2003)
")
21
Number of active primary wood-using mills (Riva and Gallion, 2003)
")
22
Output per mill, MBF.

23
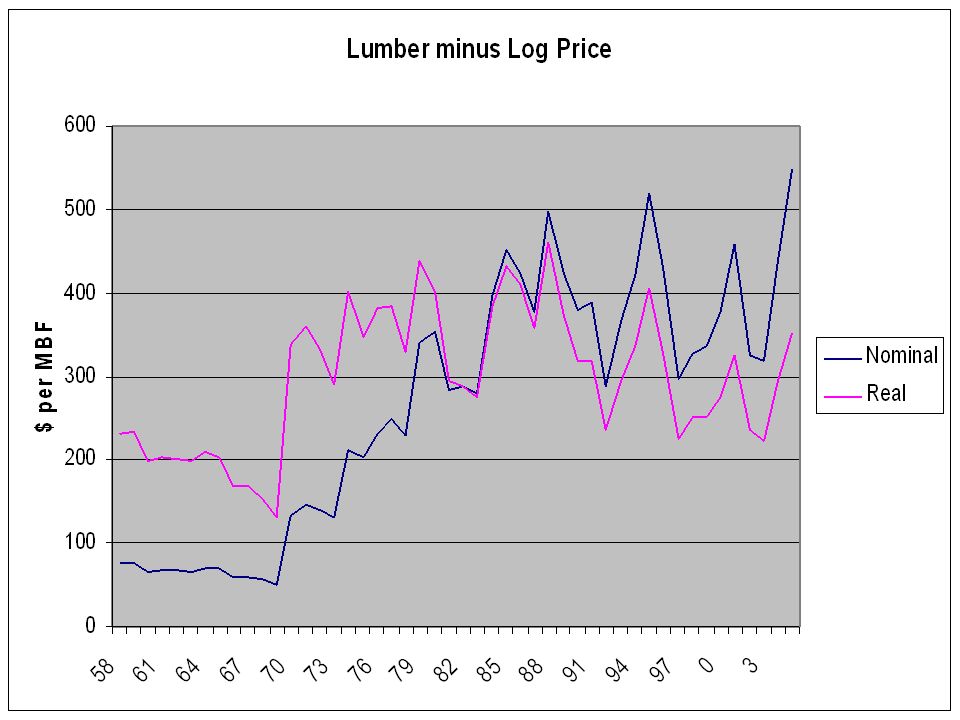
Indiana Forest Products Price Report and Trend Analysis FNR website –http://www.ces.purdue.edu/extmedia/FNR/FN R-177-W.pdfhttp://www.ces.purdue.edu/extmedia/FNR/FN R-177-W.pdf

24
Delivered Log Prices- Average Stand 1.1% per annum

25
Delivered Log Prices – Quality Stand 1.5% per annum

26
Species as a factor in timing of timber sales Prime species Non-prime species

27
Non-Prime Species

29
Prime Species

35
Efficiency of Stumpage Market Theory is that buyer pays same price for all the stumpage it purchases –Price based on intersection of S s and D s Price paid by mill for all logs of one quality $/MBF Quantity of delivered logs, MBF/year Total log cost $millions 1008,0000.80 15010,0001.5 20012,0002.4 25014,0003.5 30016,0004.8 35018,0006.3

36
Efficiency of Stumpage Market Example –Mill buys 12,000 MBF @ $200/MBF Total cost is $2,400,000 –Mill wants to increase output, need to buy 14,000 MBF. Must increase price to $250/MBF Total cost is $3,500,000 Increase in total cost is $1,100,000 Marginal cost is ΔVC/ Δ Q, –$1,100,000/2,000 = $550/MBF –MC isn’t $250 - $200 = $50

37
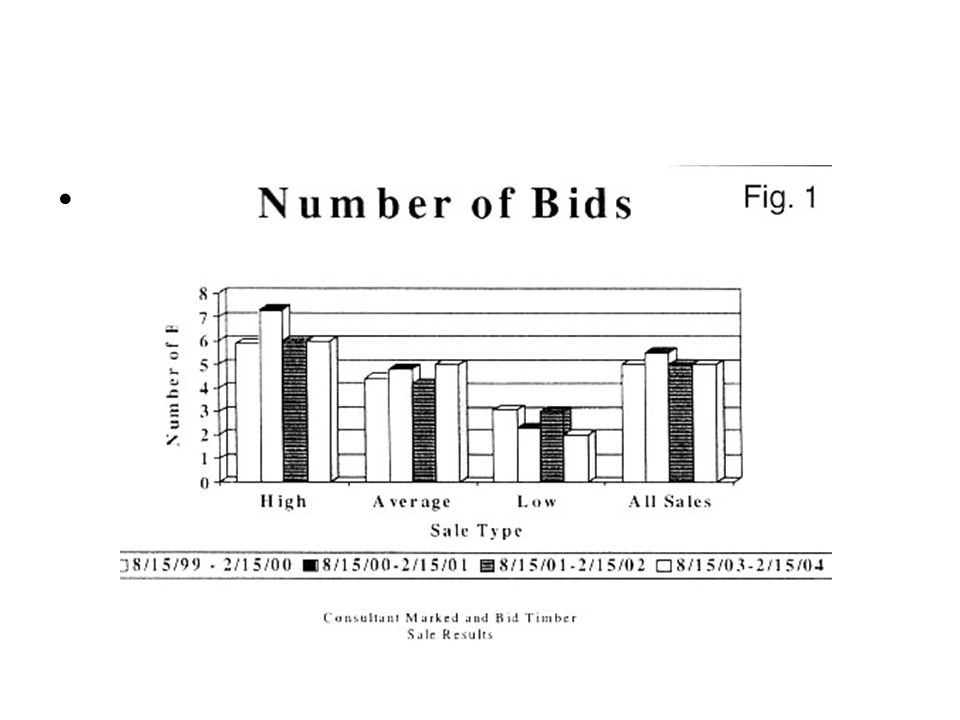
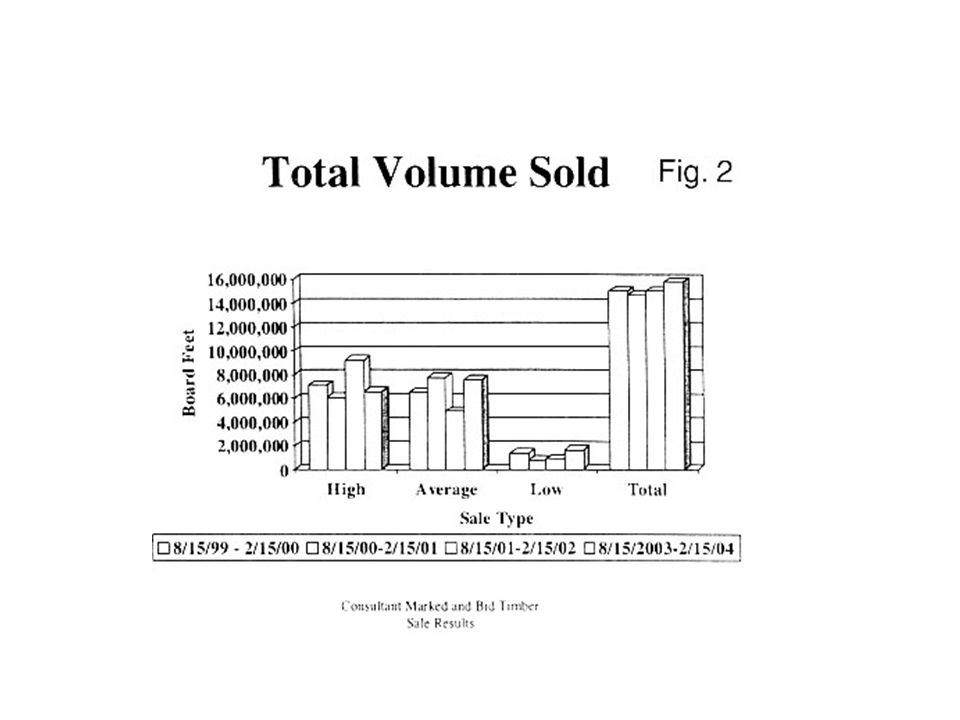
Efficiency of Indiana’s Stumpage Market Stumpage markets are segmented by – Average quality of timber stand, and – How timber is sold Sealed bid, usually with a consulting forester conducting the sale (highest price), ~ 15% of stumpage purchased One-on-one negotiation between single buyer and timber owner (lower price) Owner accepts first offer made by buyer (lowest price)
, ~ 15% of stumpage purchased One-on-one negotiation between single buyer and timber owner (lower price) Owner accepts first offer made by buyer (lowest price)")
45
Efficiency of Indiana’s Stumpage Market What are implications of this price discrimination? –To forestland owner –To mills

46
Should All Stumpage Sellers Get Consultant’s Bid Prices? Currently –380 MMBF sold –15% @ $510 per MBF –85% @ $300 per MBF –Stumpage cost to mills - $126 million All sold at bid price –$194 million –$68 million cost increase to mills

47
Should All Stumpage Sellers Get Consultants’ Bid Prices? Hold cost to mills constant at current level of $126 mil for 380 MMBF –Average stumpage price would be $332 What’s fair?

48
Should all timber be sold on bid?

Similar presentations


 Demand and Supply. Time Periods Short-run – all factors (shifters) are held constant, only P and Q change. Long-run – all factors can.>")


