Download presentation
Presentation is loading. Please wait.

1
Morbidity and Mortality in People with Serious Mental Illness National Association of State Mental Health Program Directors Medical Directors Council July 2006

2
Overview- THE PROBLEM Increased Morbidity and Mortality Associated with Serious Mental Illness (SMI) Increased Morbidity and Mortality Largely Due to Preventable Medical Conditions Metabolic Disorders, Cardiovascular Disease, Diabetes Mellitus High Prevalence of Modifiable Risk Factors (Obesity, Smoking) Epidemics within Epidemics (e.g., Diabetes, Obesity) Some Psychiatric Medications Contribute to Risk Established Monitoring and Treatment Guidelines to Lower Risk Are Underutilized in SMI Populations
 Increased Morbidity and Mortality Largely Due to Preventable Medical Conditions Metabolic Disorders, Cardiovascular Disease, Diabetes Mellitus High Prevalence of Modifiable Risk Factors (Obesity, Smoking) Epidemics within Epidemics (e.g., Diabetes, Obesity) Some Psychiatric Medications Contribute to Risk Established Monitoring and Treatment Guidelines to Lower Risk Are Underutilized in SMI Populations")
3
Overview - PROPOSED SOLUTIONS Prioritize the Public Health Problem Target Providers, Families and Clients Focus on Prevention and Wellness Track Morbidity and Mortality in Public Mental Health Populations Implement Established Standards of Care Prevention, Screening and Treatment Improve Access to and Integration of Physical Health and Mental Health Care

4
Why Should we be Concerned About Morbidity and Mortality? Recent data from several states have found that people with serious mental illness served by our public mental health systems die, on average, at least 25 years earlier that the general population.

5
SMR = standardized mortality ratio (observed/expected deaths). 1.Harris et al. Br J Psychiatry. 1998;173:11. Newman SC, Bland RC. Can J Psych. 1991;36:239-245. 2.Osby et al. Arch Gen Psychiatry. 2001;58:844-850. 3.Osby et al. BMJ. 2000;321:483-484. Increased Mortality From Medical Causes in Mental Illness Increased risk of death from medical causes in schizophrenia and 20% (10-15 yrs) shorter lifespan1 Bipolar and unipolar affective disorders also associated with higher SMRs from medical causes 2 –1.9 males/2.1 females in bipolar disorder –1.5 males/1.6 females in unipolar disorder Cardiovascular mortality in schizophrenia increased from 1976-1995, with greatest increase in SMRs in men from 1991-1995 3
 shorter lifespan1 Bipolar and unipolar affective disorders also associated with higher SMRs from medical causes 2 –1.9 males/2.1 females in bipolar disorder –1.5 males/1.6 females in unipolar disorder Cardiovascular mortality in schizophrenia increased from , with greatest increase in SMRs in men from")
6
Recent Multi-State Study Mortality Data: Years of Potential Life Lost Compared to the general population, persons with major mental illness typically lose more than 25 years of normal life span Colton CW, Manderscheid RW. Prev Chronic Dis [serial online] 2006 Apr [date cited]. Available from: URL:http://www.cdc.gov/pcd/issues/2006/apr/05_0180.htm

7
Ohio Study-1998-2002 Mean Years of Potential Life lost 20,018 persons discharged, 608 deaths

8
Massachusetts Study: Deaths from Heart Disease by Age Group/DMH Enrollees with SMI Compared to Massachusetts 1998-2000 3.5 RR 4.9RR 2.2RR 1.5RR

9
Maine Study Results: Comparison of Health Disorders Between SMI & Non-SMI Groups

10
Ohio Study Leading Causes of Death

11
Ohio Study Standardized Mortality Ratios

12
What are the Causes of Morbidity and Mortality in People with Serious Mental Illness? While suicide and injury account for about 30- 40% of excess mortality, about 60% of premature deaths in persons with schizophrenia are due to “natural causes” –Cardiovascular disease –Diabetes –Respiratory diseases –Infectious diseases

13
Need slide (see next) from CDC paper indicating CVD as leading cause of death…this should be simple and direct
 from CDC paper indicating CVD as leading cause of death…this should be simple and direct")
15
Osby U et al. Schizophr Res. 2000;45:21-28. Schizophrenia: Natural Causes of Death Higher standardized mortality rates than the general population from: –Diabetes 2.7x –Cardiovascular disease2.3x –Respiratory disease3.2x –Infectious diseases 3.4x Cardiovascular disease associated with the largest number of deaths –2.3 X the largest cause of death in the general population

16
Cardiovascular risk factors – overview BMI = body mass index; TC = total cholesterol; DM = diabetes mellitus; HTN = hypertension. Wilson PWF et al. Circulation. 1998;97:1837–1847. 0 2 4 6 8 10 12 14 HTNDMSmokingBMI >27TC >220 Single Risk Factors Multiple Risk Factors Odds ratios Smoking + BMI 2 + TC >220 3 Smoking + BMI + TC >220 + DM 4 Smoking + BMI + TC >220 + DM + HTN 5 The Framingham Study

17
Cardiovascular Disease (CVD) Risk Factors Modifiable Risk Factors Estimated Prevalence and Relative Risk (RR) Schizophrenia Bipolar Disorder Obesity 45 – 55%, 1.5-2X RR 1 26% 5 Smoking 50 – 80%, 2-3X RR 2 55% 6 Diabetes 10 – 14%, 2X RR 3 10% 7 Hypertension ≥18% 4 15% 5 Dyslipidemia Up to 5X RR 8 1. Davidson S, et al. Aust N Z J Psychiatry. 2001;35:196-202. 2. Allison DB, et al. J Clin Psychiatry. 1999; 60:215-220. 3. Dixon L, et al. J Nerv Ment Dis. 1999;187:496-502. 4. Herran A, et al. Schizophr Res. 2000;41:373-381. 5. MeElroy SL, et al. J Clin Psychiatry. 2002;63:207-213. 6. Ucok A, et al. Psychiatry Clin Neurosci. 2004;58:434-437. 7. Cassidy F, et al. Am J Psychiatry. 1999;156:1417-1420. 8. Allebeck. Schizophr Bull. 1999;15(1)81-89.
")
18
Allison DB et al. J Clin Psychiatry. 1999;60:215-220. Percent < 18.518.5-2020-2222-2424-2626-2828-3030-3232-34> 34 0 10 20 30 No schizophrenia Schizophrenia ObeseOverweightAcceptable Under- weight BMI Range BMI Distributions for General Population and Those With Schizophrenia (1989)
.")
19
Mental Disorders and Smoking Higher prevalence (56-88% for patients with schizophrenia) of cigarette smoking (overall U.S. prevalence 25%) Higher prevalence (56-88% for patients with schizophrenia) of cigarette smoking (overall U.S. prevalence 25%) More toxic exposure for patients who smoke (more cigarettes, larger portion consumed) More toxic exposure for patients who smoke (more cigarettes, larger portion consumed) Smoking is associated with increased insulin resistance Smoking is associated with increased insulin resistance Similar prevalence in bipolar disorder Similar prevalence in bipolar disorder George TP et al. Nicotine and tobacco use in schizophrenia. In: Meyer JM, Nasrallah HA, eds. Medical Illness and Schizophrenia. American Psychiatric Publishing, Inc. 2003; Ziedonis D, Williams JM, Smelson D. Am J Med Sci. 2003(Oct);326(4):223-330
 Higher prevalence (56-88% for patients with schizophrenia) of cigarette smoking (overall U.S. prevalence 25%) More toxic exposure for patients who smoke (more cigarettes, larger portion consumed) More toxic exposure for patients who smoke (more cigarettes, larger portion consumed) Smoking is associated with increased insulin resistance Smoking is associated with increased insulin resistance Similar prevalence in bipolar disorder Similar prevalence in bipolar disorder George TP et al. Nicotine and tobacco use in schizophrenia. In: Meyer JM, Nasrallah HA, eds. Medical Illness and Schizophrenia. American Psychiatric Publishing, Inc. 2003; Ziedonis D, Williams JM, Smelson D. Am J Med Sci. 2003(Oct);326(4):")
20
Harris et al. Diabetes Care. 1998; 21:518. Mukherjee et al. Compr Psychiatry. 1996; 37(1):68-73. Schizophrenic: General: 50-59 y 60-74 y 75+ y Percent of population Prevalence of Diagnosed Diabetes in General Population Versus Schizophrenic Population
: Schizophrenic: General: y y 75+ y Percent of population Prevalence of Diagnosed Diabetes in General Population Versus Schizophrenic Population.")
21
Hypothesized Reasons Why There May Be More Type 2 Diabetes in People With Schizophrenia Genetic link between schizophrenia and diabetes Impact of lifestyle Medication effect increasing insulin resistance by impacting insulin receptor or postreceptor function Drug effect on caloric intake or expenditure (obesity, activity)
")
22
How Does This Relate to What is Happening in the General Population? There is an “epidemic” of obesity and diabetes, increasing risk of multiple medical conditions and cardiovascular disease. –Obesity –Diabetes –Metabolic Syndrome –Cardiovascular Disease

23
Mokdad et al. Diabetes Care. 2000;23:1278. Mokdad et al. JAMA. 1999;282:1519. Mokdad et al. JAMA. 2001;286:1195. Prevalence (%) Diabetes Mean body weight kg Year Diabetes and Obesity: The Continuing Epidemic
 Diabetes Mean body weight kg Year Diabetes and Obesity: The Continuing Epidemic.")
24
Behavioral Risk Factor Surveillance System, CDC. (*BMI 30, or about 30 lbs overweight for 5’4” person) 1996 2003 Obesity Trends* Among US Adults BRFSS, 1991, 1996, 2003 1991 No Data<10%10%-14%15%-19%20%-24% 25%
 Obesity Trends* Among US Adults BRFSS, 1991, 1996, No Data<10%10%-14%15%-19%20%-24% 25%.")
25
No Data Less than 4% 4% to 6% Above 6% Mokdad et al. Diabetes Care. 2000;23:1278-1283. Diabetes and Gestational Diabetes Trends: US Adults, BRFSS 1990

26
Mokdad et al. Diabetes Care. 2000;23:1278-1283. Diabetes and Gestational Diabetes Trends: US Adults, BRFSS 1995 No Data Less than 4% 4% to 6% Above 6%

27
Mokdad et al. Diabetes Care. 2001;24:412. Diabetes and Gestational Diabetes Trends: US Adults, BRFSS 1999 No Data Less than 4% 4% to 6% Above 6%

28
Mokdad et al. JAMA. 2001;286(10). Diabetes and Gestational Diabetes Trends: US Adults, BRFSS 2000 No Data Less than 4% 4% to 6% Above 6%

29
www.diabetes.org. No Data Less than 4% 4% to 6% Above 6% Above 10% Diabetes and Gestational Diabetes Trends: US Adults, Estimate for 2010

30
Men and Women, Age 45-74 Years Harris et al. Diabetes. 1987;36:523. Flegal et al. Diabetes Care. 1991;14(suppl 3):628. Knowler et al. Diabetes Care. 1993;16(suppl 1):216. Fujimoto et al. Diabetes Res Clin Pract. 1991;13:119. Fujimoto et al. Diabetes. 1987;36:721. % with diabetes 0 10 20 30 40 50 PimaPuerto Rican Mexican American African American Japanese American Cuban American European US Diabetes Prevalence by Ethnic Group
:628. Knowler et al. Diabetes Care. 1993;16(suppl 1):216. Fujimoto et al. Diabetes Res Clin Pract. 1991;13:119. Fujimoto et al. Diabetes. 1987;36:721. % with diabetes PimaPuerto Rican Mexican American African American Japanese American Cuban American European US Diabetes Prevalence by Ethnic Group.")
31
Adapted from: International Diabetes Center (IDC). Available at: www.parknicollet.com/diabetes/disease/diagnosing.cfm. Accessed March 26, 2006. www.parknicollet.com/diabetes/disease/diagnosing.cfm Years of Diabetes Uncontrolled Obesity IGT Diabetes Hyperglycemia Relative -Cell Function 100 (%) -20-100102030 Plasma Glucose Insulin Resistance Insulin Level 126 (mg/dL) Fasting Glucose Post- Meal Glucose IGT = impaired glucose tolerance. Natural History of Type 2 Diabetes
 Plasma Glucose Insulin Resistance Insulin Level 126 (mg/dL) Fasting Glucose Post- Meal Glucose IGT = impaired glucose tolerance. Natural History of Type 2 Diabetes.")
32
Prevalence of Diabetic Tissue Damage at Diagnosis of Type 2 Diabetes Prevalence Dagogo-Jack et al. Arch Int Med. 1997;157:1802-1817.

33
Haffner SM et al. N Engl J Med. 1998;339:229-234. Fatal or nonfatal MI (%) 3.5% 18.6% 20.2% 45.0% Equivalent MI Risk Levels No Prior MIPrior MINo Prior MIPrior MI Nondiabetic SubjectsType 2 Diabetic Subjects (n = 1373)(n = 1059) Diabetes is a CVD Risk Equivalent to Previous Myocardial Infarction
 3.5% 18.6% 20.2% 45.0% Equivalent MI Risk Levels No Prior MIPrior MINo Prior MIPrior MI Nondiabetic SubjectsType 2 Diabetic Subjects (n = 1373)(n = 1059) Diabetes is a CVD Risk Equivalent to Previous Myocardial Infarction.")
34
ADA Cardiometabolic Risk Initiative

35
Identification of the Metabolic Syndrome ≥3 Risk Factors Required for Diagnosis Risk Factor Defining Level Abdominal obesity Men Women Abdominal obesity Men Women Waist circumference >40 in (>102 cm) >35 in (>88 cm) Waist circumference >40 in (>102 cm) >35 in (>88 cm) Triglycerides Triglycerides 150 mg/dL (1.69mmol/L) 150 mg/dL (1.69mmol/L) HDL cholesterol Men Women HDL cholesterol Men Women <40 mg/dL (1.03mmol/L) <50 mg/dL (1.29mmol/L) <40 mg/dL (1.03mmol/L) <50 mg/dL (1.29mmol/L) Blood pressure Blood pressure 130/85 mm Hg 130/85 mm Hg Fasting blood glucose Fasting blood glucose 110 mg/dL (6.1mmol/L) 110 mg/dL (6.1mmol/L) HDL = high-density lipoprotein. NCEP III. Circulation. 2002;106:3143-3421.

36
CHD Risk Increases with Increasing Number of Metabolic Syndrome Risk Factors Sattar et al, Circulation, 2003;108:414-419 Whyte et al, American Diabetes Association, 2001 Adapted from Ridker, Circulation 2003;107:393-397

37
Meyer et al., Presented at APA annual meeting, May 21-26, 2005. McEvoy JP et al. Schizophr Res. 2005;(August 29).
..")
38
N=12,363 “Overweight” = BMI 25-29.9 “Obese” = BMI 30 ( National Heart, Lung, and Blood Institute, Obesity Guidelines) MenWomen Prevalence of Metabolic Syndrome According to BMI in the Adult General Population Park et al. Arch Intern Med. 2003;163:427.

39
Modifiable Risk Factors Affected by Psychotropics Overweight / Obesity Insulin resistance Diabetes/hyperglycaemiaDyslipidemia Newcomer JW. CNS Drugs 2005;19(Supp 1):1.93.
:")
40
1-Year Weight Gain: Mean Change From Baseline Weight Change From Baseline Weight (lb) Weeks Change From Baseline Weight (kg) 52 48 44 40363228242016128400 Olanzapine (12.5–17.5 mg) Olanzapine (all doses) Quetiapine Risperidone Ziprasidone Aripiprazole 0 5 10 15 20 25 30 0 2 4 6 8 10 12 14 Nemeroff CB. J Clin Psychiatry. 1997;58(suppl 10):45-49; Kinon BJ et al. J Clin Psychiatry. 2001;62:92-100; Brecher M et al. American College of Neuropsychopharmacology; 2004. Poster 114; Brecher M et al. Neuropsychopharmacology. 2004;29(suppl 1):S109; Geodon ® [package insert]. New York, NY:Pfizer Inc; 2005. Risperdal ® [package insert]. Titusville, NJ: Janssen Pharmaceutica Products, LP; 2003; Abilify ® [package insert]. Princeton NJ: Bristol-Myers Squibb Company and Rockville, Md: Otsuka America Pharmaceutical, Inc.; 2005.
:45-49; Kinon BJ et al. J Clin Psychiatry. 2001;62:92-100; Brecher M et al. American College of Neuropsychopharmacology; Poster 114; Brecher M et al. Neuropsychopharmacology. 2004;29(suppl 1):S109; Geodon ® [package insert]. New York, NY:Pfizer Inc; Risperdal ® [package insert]. Titusville, NJ: Janssen Pharmaceutica Products, LP; 2003; Abilify ® [package insert]. Princeton NJ: Bristol-Myers Squibb Company and Rockville, Md: Otsuka America Pharmaceutical, Inc.;")
41
CATIE Trial Results: Weight Gain Per Month Treatment NEJM 2005 353:1209-1223 OLZRIS PER QUET ZIP Weight gain (lb) per month
 per month")
42
Conventionals Olanzapine Risperidone -25 -20 -15 -10 -5 0 5 LS Mean Change (lb) 4953 58 454036 32 27 23 19 14 10 6 * *** ** *** *P<0.05 **P<0.01 ***P<0.0001 Switched from Weiden P et al. Presented APA 2004. Change in Weight From Baseline 58 Weeks After Switch to Low Weight Gain Agent

43
Levels of Evidence Case reports, case series, uncontrolled observational studies - hypothesis-generation only Retrospective database analyses - could be hypothesis-testing, but methodological issues might limit these to hypothesis-generation Controlled analytic studies, including randomized clinical trials - hypothesis-testing Casey DE, Haupt DW, Newcomer JW, Henderson DC, Sernyak MJ, Davidson M, Lindenmayer JP, Manoukian SV, Banerji MA, Lebovitz HE, Hennekens CH, J Clin Psychiatry 65(Suppl 7):4-18, 2004.
:4-18, 2004.")
44
Modifiable Risk Factors Affected by Psychotropics Overweight / Obesity Insulin resistance Diabetes/hyperglycaemiaDyslipidemia Newcomer JW. CNS Drugs 2005;19(Supp 1):1.93.
:")
45
Randomized Clinical Trials Insulin resistance Insulin resistance Fasting lipids Fasting lipids Fasting or post-load glucose and insulin Fasting or post-load glucose and insulin Metabolic syndrome Metabolic syndrome Growing number of studies measure drug effects on the following:

46
CATIE Results: Metabolic Changes From Baseline OLZRIS PER QUET ZIP 9.4 -8.2 1.3 -1.3 6.6 40.5 21.2 -2.4 9.2 - 16.5 Cholesterol (mg/dL) Triglycerides (mg/dL) NEJM 2005 353:1209-1223
 Triglycerides (mg/dL) NEJM :")
47
CATIE Results: Metabolic Changes From Baseline NEJM 2005 353:1209-1223 Glucose (mg/dL) Glycosylated HB (%) 13.7 0.11 2.9 0.0 5.4 0.07 6.6 0.04 7.5 0.4 OLZRIS PER QUET ZIP
 Glycosylated HB (%) OLZRIS PER QUET ZIP")
48
American Diabetes Association, American Psychiatric Association, American Association of Clinical Endocrinologists, North American Association for the Study of Obesity: Consensus Conference on Antipsychotic Drugs and Risk of Obesity and Diabetes + = increased effect; - = no effect; D = discrepant results. Drug Weight Gain Diabetes Risk Dyslipidemia clozapine + + + ++ olanzapine ++ risperidone + + DD quetiapine DD aripiprazole+/--- ziprasidone+/--- Diabetes Care 27:596-601, 2004

49
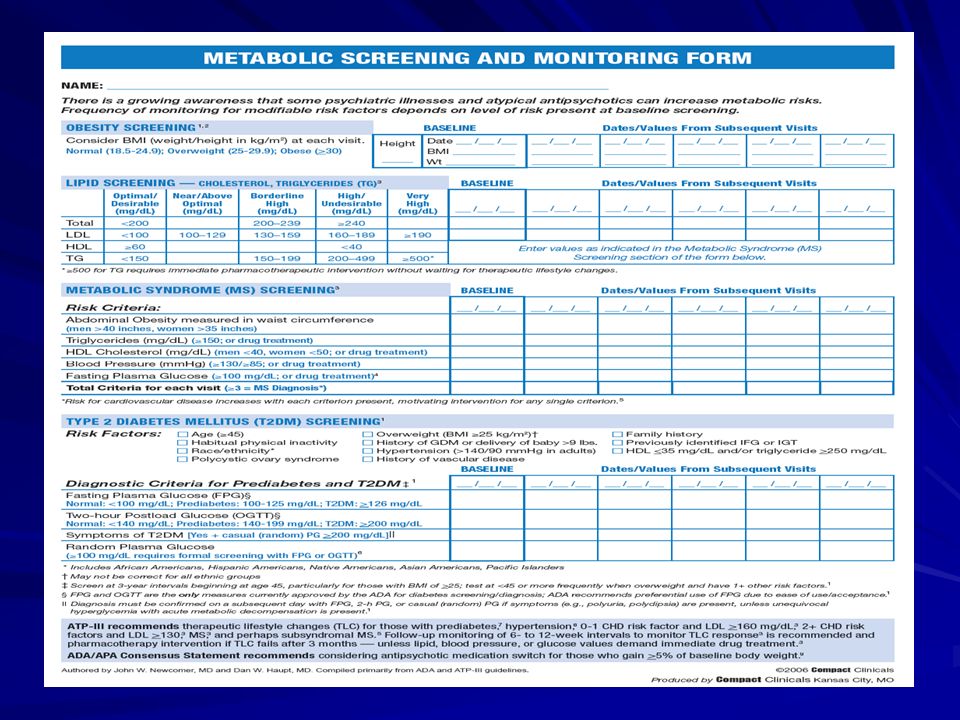
ADA/APA/AACE/NAASO Consensus on Antipsychotic Drugs and Obesity and Diabetes: Monitoring Protocol * *More frequent assessments may be warranted based on clinical status Diabetes Care. 27:596-601, 2004Start 4 wks 8 wks 12 wk qtrly 12 mos. 5 yrs. Personal/family Hx XX Weight (BMI) XXXXX Waist circumference XX Blood pressure XXX Fasting glucose XXX Fasting lipid profile XXX X X
 XXXXX Waist circumference XX Blood pressure XXX Fasting glucose XXX Fasting lipid profile XXX X X.")
51
Problem: SMI and Reduced Use of Medical Services Fewer routine preventive services (Druss 2002) Worse diabetes care (Desai 2002, Frayne 2006) Lower rates of cardiovascular procedures (Druss 2000)
 Worse diabetes care (Desai 2002, Frayne 2006) Lower rates of cardiovascular procedures (Druss 2000)")
52
Access and Quality of Care SMI may be a health risk factor because of: –Patient factors, e.g.: amotivation, fearfulness, homelessness, victimization/trauma, resources, advocacy, unemployment, incarceration, social instability, IV drug use, etc –Provider factors: Comfort level and attitude of healthcare providers, coordination between mental health and general health care, stigma, –System factors: Funding, fragmentation

53
Hennekens CH. Circulation. 1998;97:1095-1102. Goals: Lower Risk for CVD Blood cholesterol –10% = 30% in CHD (200-180) High blood pressure (> 140 SBP or 90 DBP) –4-6 mm Hg = 16% in CHD; 42% in stroke Cigarette smoking cessation –50%-70% in CHD Maintenance of ideal body weight (BMI = 25) Maintenance of ideal body weight (BMI = 25) –35%-55% in CHD Maintenance of active lifestyle (20-min walk daily) –35%-55% in CHD
 High blood pressure (> 140 SBP or 90 DBP) –4-6 mm Hg = 16% in CHD; 42% in stroke Cigarette smoking cessation –50%-70% in CHD Maintenance of ideal body weight (BMI = 25) Maintenance of ideal body weight (BMI = 25) –35%-55% in CHD Maintenance of active lifestyle (20-min walk daily) –35%-55% in CHD.")
54
Survival Following Myocardial Infarction 88,241 Medicare patients, 65 years of age and older, hospitalized for MI Mortality increased by –19%: any mental disorder –34%: schizophrenia Increased mortality explained by measures of quality of care Druss BG et al. Arch Gen Psychiatry. 2001;58:565-572.

55
Disparities in care: impact of mental illness on diabetes management 313,586 Veteran Health Authority patients with diabetes 76,799 (25%) had mental health conditions (1999) Frayne et al. Arch Intern Med. 2005;165:2631-2638 Depression Anxiety Psychosis Mania Substance use disorder Personality disorder 0.81.01.21.41.6 No HbA test done 0.81.01.21.41.6 No LDL test done 0.81.01.21.41.6 No Eye examination done 0.81.01.21.41.6 No Monitoring 0.81.01.21.41.6 Poor glycemic control 0.81.01.21.41.6 Poor lipemic control Odds ratio for:

56
Why Should we be Concerned About Morbidity and Mortality? Recent data from several states have found that people with serious mental illness served by our public mental health systems die, on average, at least 25 years earlier that the general population.

57
Overview - PROPOSED SOLUTIONS Prioritize the Public Health Problem Target Providers, Families and Clients Focus on Prevention and Wellness Track Morbidity and Mortality in Public Mental Health Populations Implement Established Standards of Care Prevention, Screening and Treatment Improve Access to and Integration of Physical Health and Mental Health Care

58
Recommendations Recommendations NATIONAL LEVEL 1. 1. Seek federal designation of people with SMI as a distinct at-risk health disparities population. Establish co-ordinated mental health and general health care as a national healthcare priority. 2. 2. Establish a committee at the federal level to recommend changes to national surveillance activities that will incorporate information about health status in the population with SMI. Consider representation from SAMHSA, Medicaid, the Centers for Disease Control and Prevention, state MH authorities / NASMHPD, and experts This may include the IOM project and other national surveys.

59
Recommendations Recommendations NATIONAL LEVEL 3. 3. Share information widely about physical health risks in persons with SMI to encourage awareness and advocacy. Educate the health care community. Encourage consumers and family members to advocate for wellness approaches as part of recovery.

60
Recommendations Recommendations STATE LEVEL 1. 1. Seek state designation of people with SMI as BOTH an at-risk and a health disparities population. 2. 2. Establish co-ordinated mental health and general health care as a state healthcare priority. 3. 3. Education and advocacy policy makers funders providers individuals, family, community

61
Recommendations Recommendations STATE LEVEL 4. 4.Require, regulate and lead Behavioral Health provider systems to screen, assess and treat both mental health and general health care issues. Provide for staffing time record keeping reimbursement linkage with physical healthcare providers 5.Funding 6. 6.Promote co-ordinated and integrated mental health and physical health care for persons with SMI. See 11th NASMHPD Technical Paper: Integrating Mental Health and Primary Care.

62
Recommendations Recommendations STATE LEVEL 5. 5. Develop a quality improvement (QI) process that supports increased access to physical healthcare and ensures appropriate prevention, screening and treatment services. Target common causes of increased mortality and chronic medical illness in the SMI population Include all key stakeholders: state agencies, practitioners, individuals and their families, academic and training institutions in QI planning and review A key component : training and technical assistance for practitioners in both mental health and primary health fields
 process that supports increased access to physical healthcare and ensures appropriate prevention, screening and treatment services. Target common causes of increased mortality and chronic medical illness in the SMI population Include all key stakeholders: state agencies, practitioners, individuals and their families, academic and training institutions in QI planning and review A key component : training and technical assistance for practitioners in both mental health and primary health fields.")
63
Recommendations LOCAL AGENCY / CLINICIAN 1. 1.BH providers shall provide quality medical care and mental health care Screen for general health with priority for high risk conditions Offer prevention and intervention especially for modifiable risk factors (obesity, abnormal glucose and lipid levels, high blood pressure, smoking, alcohol and drug use, etc.) Prescribers will screen, monitor and intervene for medication risk factors related to treatment of SMI (e.g. risk of metabolic syndrome with use of second generation anti-psychotics) Treatment per practice guidelines, e.g heart disease, diabetes, smoking cessation, use of novel anti-psychotics.
 Prescribers will screen, monitor and intervene for medication risk factors related to treatment of SMI (e.g. risk of metabolic syndrome with use of second generation anti-psychotics) Treatment per practice guidelines, e.g heart disease, diabetes, smoking cessation, use of novel anti-psychotics..")
64
LOCAL AGENCY / CLINICIAN Recommendations 2. Care coordination Models l lAssure that there is a specific practitioner in the MH system who is identified as the responsible party for each person’s medical health care needs being addressed and who assures coordination all services. Routine sharing of clinical information with other providers (primary and specialty healthcare providers as well as mental health providers Care integration where services are co-located

65
LOCAL AGENCY / CLINICIAN RECOMMENDATIONS 3. Support consumer wellness and empowerment to improve personal mental and physical well-being educate / share information to make healthy choices regarding nutrition, tobacco use, exercise, implications of psychotropic drugs teach /support wellness self-management skills teach /support decision making skills motivational interviewing techniques Implement a physical health Wellness approach that is consistent with Recovery principles, including supports for smoking cessation, good nutrition, physical activity and healthy weight. attend to cultural and language needs

66
Overview - PROPOSED SOLUTIONS Prioritize the Public Health Problem Target Providers, Families and Clients Focus on Prevention and Wellness Track Morbidity and Mortality in Public Mental Health Populations Implement Established Standards of Care Prevention, Screening and Treatment Improve Access to and Integration of Physical Health and Mental Health Care

67
Full report available at http://www.nasmhpd.org/publications.cfm#techpap

Similar presentations


 describes relative weight for height: weight (kg)/height (m 2 ) Overweight = 25–29.9 BMI Obesity = >30 BMI.>")


