Download presentation
Presentation is loading. Please wait.

1
Chapter 6 (Lecture Outline and Line Art Presentation) The Basics of Planning and Project Management
 The Basics of Planning and Project Management")
2
Copyright © Houghton Mifflin Company. All rights reserved.Lecture Outline and Line Art Presentation, 6–2 Chapter Objectives 1.Distinguish among state, effect, and response uncertainty. 2.Identify and define three types of planning. 3.Write good objectives and discuss the role of objectives in planning. 4.Describe the four-step management by objectives (MBO) process and explain how it can foster individual commitment and motivation. 5.Discuss project planning within the context of the project life cycle.
 process and explain how it can foster individual commitment and motivation. 5.Discuss project planning within the context of the project life cycle..")
3
Copyright © Houghton Mifflin Company. All rights reserved.Lecture Outline and Line Art Presentation, 6–3 Chapter Objectives (cont’d) 6.Summarize the pros and cons of enterprise resource planning (ERP). 7.Compare and contrast flow charts and Gantt charts, and discuss the value of PERT networks. 8.Explain how break-even points are calculated.
 6.Summarize the pros and cons of enterprise resource planning (ERP). 7.Compare and contrast flow charts and Gantt charts, and discuss the value of PERT networks. 8.Explain how break-even points are calculated..")
4
Copyright © Houghton Mifflin Company. All rights reserved.Lecture Outline and Line Art Presentation, 6–4 Coping with Uncertainty Planning Coping with uncertainty by formulating courses of action to achieve specified results. Three Types of Uncertainty State uncertainty: occurs when the environment, or a portion of the environment, is considered unstable. Effect uncertainty: occurs when impacts of environmental change are unpredictable. Response uncertainty: arises when the consequences of decisions are unpredictable.

5
Copyright © Houghton Mifflin Company. All rights reserved.Lecture Outline and Line Art Presentation, 6–5 Figure 6.1 Planning: The Primary Management Function

6
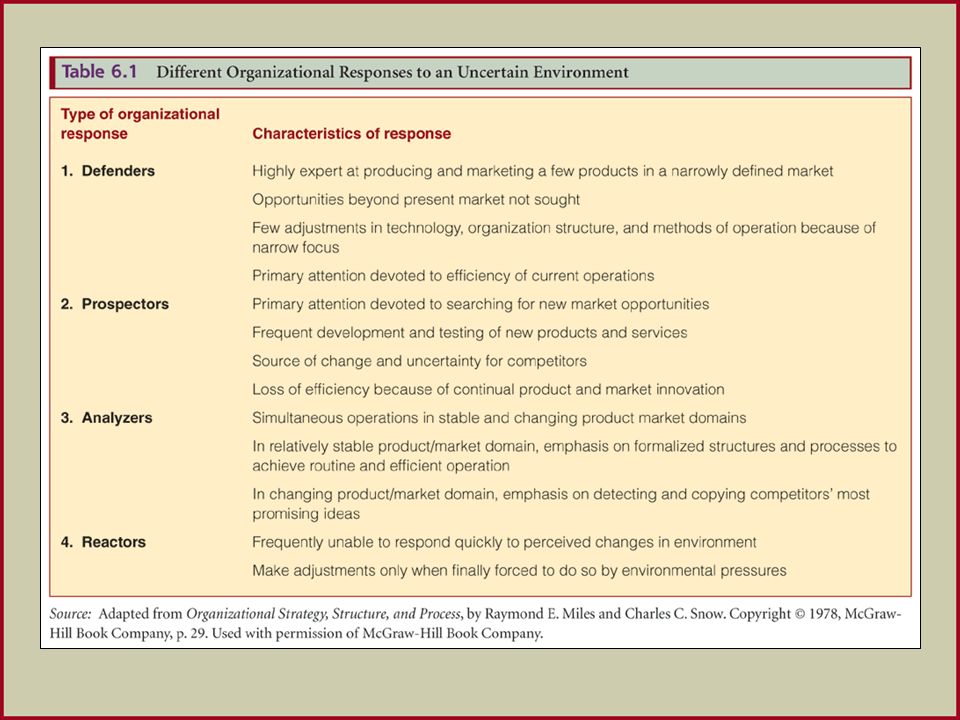
Copyright © Houghton Mifflin Company. All rights reserved.Lecture Outline and Line Art Presentation, 6–6 Coping with Uncertainty (cont’d) Organizational Responses to Uncertainty Defenders: relying on a primary technology and/or a narrow product line to remain competitive. Prospectors: seeking first-mover advantage by aggressively making things happen and not waiting for them to happen. Analyzers: following the market leader and imitating what works, avoiding expensive R&D mistakes. Reactors: waiting for adversity (e.g., declining sales) to occur before taking corrective action.
 Organizational Responses to Uncertainty Defenders: relying on a primary technology and/or a narrow product line to remain competitive. Prospectors: seeking first-mover advantage by aggressively making things happen and not waiting for them to happen. Analyzers: following the market leader and imitating what works, avoiding expensive R&D mistakes. Reactors: waiting for adversity (e.g., declining sales) to occur before taking corrective action..")
8
Copyright © Houghton Mifflin Company. All rights reserved.Lecture Outline and Line Art Presentation, 6–8 Balancing Planned Action and Spontaneity in the Twenty-First Century Command-and-control Model Top-down tight control of operations through exacting planning created organizational inflexibility to deal with unanticipated events and limited success. Contingency Model Participative planning and control balance planned action with creative flexibility to take advantage of unexpected opportunities and to cope with the need for change.

9
Copyright © Houghton Mifflin Company. All rights reserved.Lecture Outline and Line Art Presentation, 6–9 The Essentials of Planning A Plan: Is a specific documented intention consisting of an objective (end) and an action statement (means). States what, when, and how something is to be done. Essentials of Sound Planning Organizational mission Types of planning Objectives Priorities The planning/control cycle
 and an action statement (means). States what, when, and how something is to be done. Essentials of Sound Planning Organizational mission Types of planning Objectives Priorities The planning/control cycle.")
10
Copyright © Houghton Mifflin Company. All rights reserved.Lecture Outline and Line Art Presentation, 6–10 The Essentials of Planning (cont’d) Organizational Mission A clear, formally written, and publicized statement that guides the organization by 1.defining the organization for key stakeholders. 2.creating an inspiring vision of the organization. 3.outlining how the vision will be accomplished. 4.establishing key priorities. 5.stating a common goal and foster togetherness. 6.creating a philosophical anchor for the organization. 7.generating enthusiasm and a “can do” attitude. 8.empowering organization members.
 Organizational Mission A clear, formally written, and publicized statement that guides the organization by 1.defining the organization for key stakeholders. 2.creating an inspiring vision of the organization. 3.outlining how the vision will be accomplished. 4.establishing key priorities. 5.stating a common goal and foster togetherness. 6.creating a philosophical anchor for the organization. 7.generating enthusiasm and a can do attitude. 8.empowering organization members..")
11
Copyright © Houghton Mifflin Company. All rights reserved.Lecture Outline and Line Art Presentation, 6–11 Types of Planning Strategic planning: determining how to pursue long- term goals with available resources. Intermediate planning: determining subunits’ contribution with allocated resources. Operational planning: determining how to accomplish specific tasks with available resources. The Essentials of Planning (cont’d)
.")
12
Copyright © Houghton Mifflin Company. All rights reserved.Lecture Outline and Line Art Presentation, 6–12 Figure 6.2 Types of Planning

13
Copyright © Houghton Mifflin Company. All rights reserved.Lecture Outline and Line Art Presentation, 6–13 Planning Horizon The elapsed time between the formulation and the execution of a planned activity. Planning horizon length corresponds to the type of plan with which it is associated; lengths shorten as the planning process evolves from strategic to intermediate to operational plans. The Essentials of Planning (cont’d)
.")
14
Copyright © Houghton Mifflin Company. All rights reserved.Lecture Outline and Line Art Presentation, 6–14 Objectives An objective is a commitment to achieve a measurable result within a specified period. Writing Good Objectives Objectives should be expressed in quantitative, measurable, and concrete terms. What specific result is to be achieved? When is the result to be achieved? How the result is to be measured? Who will be responsible for achieving the result? The Essentials of Planning (cont’d)
.")
15
Copyright © Houghton Mifflin Company. All rights reserved.Lecture Outline and Line Art Presentation, 6–15 The Importance of Objectives (Uses of) Targets: sets specific goals to achieve. Measuring sticks: gages how much was achieved. Commitment: encourages pursuit of the objective. Motivation: provides a challenge for achievement. The Means-Ends Chain of Objectives Achievement of lower-level objectives creates a means for achieving higher-level objectives The Essentials of Planning (cont’d)
 Targets: sets specific goals to achieve. Measuring sticks: gages how much was achieved. Commitment: encourages pursuit of the objective. Motivation: provides a challenge for achievement. The Means-Ends Chain of Objectives Achievement of lower-level objectives creates a means for achieving higher-level objectives The Essentials of Planning (cont’d).")
16
Copyright © Houghton Mifflin Company. All rights reserved.Lecture Outline and Line Art Presentation, 6–16 Figure 6.3 A Typical Means-Ends Chain of Objectives

17
Copyright © Houghton Mifflin Company. All rights reserved.Lecture Outline and Line Art Presentation, 6–17 Priorities A ranking of goals, objectives, or activities in order of importance that guide the order and timing of decisions that management makes regarding the allocation of resources. The Essentials of Planning (cont’d)
.")
18
Copyright © Houghton Mifflin Company. All rights reserved.Lecture Outline and Line Art Presentation, 6–18 The A-B-C Priority System A: “Must do” objectives critical to successful performance. B: “Should do” objectives necessary for improved performance. C: “Nice to do” objectives are desirable for improved performance but not critical to survival or improved performance. The 80/20 Principle (Pareto Analysis) A majority of causes, inputs, or effort tend to produce a majority of results, outputs, or rewards. The Essentials of Planning (cont’d)
 A majority of causes, inputs, or effort tend to produce a majority of results, outputs, or rewards. The Essentials of Planning (cont’d).")
19
Copyright © Houghton Mifflin Company. All rights reserved.Lecture Outline and Line Art Presentation, 6–19 The Planning/Control Cycle Planning sets in motion activities to accomplish the planned objectives. Control functions to direct and monitor activities for deviations from plans (i.e., attainment of objectives). Planning uses feedback from controls to improve/alter plans and implement corrective actions where necessary. The Essentials of Planning (cont’d)
. Planning uses feedback from controls to improve/alter plans and implement corrective actions where necessary. The Essentials of Planning (cont’d).")
20
Copyright © Houghton Mifflin Company. All rights reserved.Lecture Outline and Line Art Presentation, 6–20 Figure 6.4 The Basic Planning/Control Cycle

21
Copyright © Houghton Mifflin Company. All rights reserved.Lecture Outline and Line Art Presentation, 6–21 Management by Objectives and Project Planning Management by Objectives (Peter Drucker) A comprehensive management system based on measurable participatively set objectives. The MBO Cycle Step 1: Setting objectives Step 2: Developing action plans Step 3: Periodic review Step 4: Performance appraisal
 A comprehensive management system based on measurable participatively set objectives. The MBO Cycle Step 1: Setting objectives Step 2: Developing action plans Step 3: Periodic review Step 4: Performance appraisal.")
22
Copyright © Houghton Mifflin Company. All rights reserved.Lecture Outline and Line Art Presentation, 6–22 Figure 6.5 MBO’s Strengths and Limitations

23
Copyright © Houghton Mifflin Company. All rights reserved.Lecture Outline and Line Art Presentation, 6–23 Project Planning and Management Project A temporary endeavor to achieve a particular aim. The Project Life Cycle Conceptualization: setting project goals and objectives. Planning: organizing facilities and equipment, personnel and task assignments, and scheduling. Execution: actual work on the project begins. Termination: project is turned over to the end user and project resources are phased out.

24
Figure 6.6 The Project Life Cycle and Project Planning Activities

26
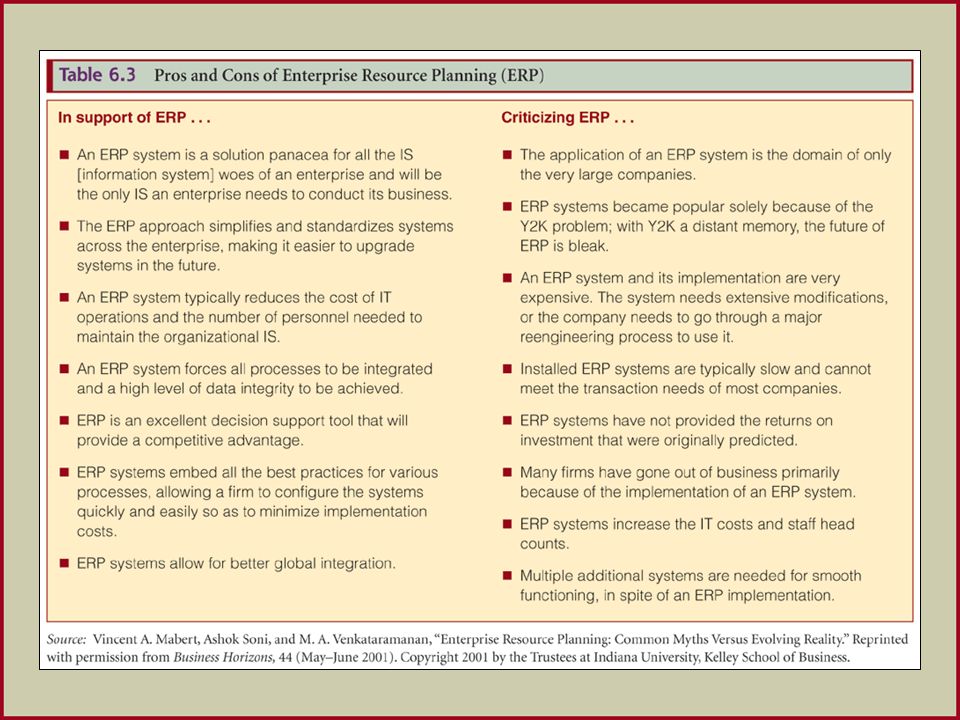
Copyright © Houghton Mifflin Company. All rights reserved.Lecture Outline and Line Art Presentation, 6–26 Project Planning and Management (cont’d) Enterprise Resource Planning (ERP) The use of computer software to create an unified computer system (database) that integrates an organization’s different functions and departments. Pros: significant savings from fewer errors, improved speed and accuracy, more complete access to information, better employee decisions through a better understanding of the organization, and improved customer relations. Cons: complex and expensive, difficult to implement and maintain due to incompatible hardware, software, and databases.
 Enterprise Resource Planning (ERP) The use of computer software to create an unified computer system (database) that integrates an organization’s different functions and departments. Pros: significant savings from fewer errors, improved speed and accuracy, more complete access to information, better employee decisions through a better understanding of the organization, and improved customer relations. Cons: complex and expensive, difficult to implement and maintain due to incompatible hardware, software, and databases..")
28
Copyright © Houghton Mifflin Company. All rights reserved.Lecture Outline and Line Art Presentation, 6–28 Project Management Guidelines Projects schedule-driven and results-oriented. The big picture and the little details are of equal importance. Project planning is a necessity, not a luxury. Project managers know the motivational power of a deadline. Project Planning and Management (cont’d)
.")
29
Copyright © Houghton Mifflin Company. All rights reserved.Lecture Outline and Line Art Presentation, 6–29 Graphic Planning/Scheduling/Control Tools Sequencing with Flow Charts Sequencing: arranging events in the order of their actual or desired occurrence. Work simplification: eliminating wasted steps and activities.

30
Figure 6.7 A Sample Flow Chart

31
Copyright © Houghton Mifflin Company. All rights reserved.Lecture Outline and Line Art Presentation, 6–31 Graphic Planning/Scheduling/Control Tools (cont’d) Scheduling with Gantt Charts Gantt chart: a graphic scheduling technique historically used in production operations. Useful for scheduling large projects where time for each activity can be specified and progress assessed. Overly complex endeavors are too cumbersome for Gantt charts.
 Scheduling with Gantt Charts Gantt chart: a graphic scheduling technique historically used in production operations. Useful for scheduling large projects where time for each activity can be specified and progress assessed. Overly complex endeavors are too cumbersome for Gantt charts..")
32
Copyright © Houghton Mifflin Company. All rights reserved.Lecture Outline and Line Art Presentation, 6–32 Figure 6.8 A Sample Gantt Chart

33
Copyright © Houghton Mifflin Company. All rights reserved.Lecture Outline and Line Art Presentation, 6–33 Program Evaluation and Review Technique (PERT) Networks Graphic sequencing and scheduling tool for large, complex, and nonroutine projects. Developed in 1958 for use in the development of the U.S. Navy’s Polaris submarine-launched missile project. Graphic Planning/Scheduling/Control Tools (cont’d)
 Networks Graphic sequencing and scheduling tool for large, complex, and nonroutine projects. Developed in 1958 for use in the development of the U.S. Navy’s Polaris submarine-launched missile project. Graphic Planning/Scheduling/Control Tools (cont’d).")
34
Copyright © Houghton Mifflin Company. All rights reserved.Lecture Outline and Line Art Presentation, 6–34 PERT Terminology Event: denotes a performance milestone. Activity: work (jobs) in process. Time: estimated weighted times for completion of an activity—optimistic, most likely, and pessimistic. Critical path: the most time consuming (longest) chain of required activities and events in a PERT network that must be completed on time or else the entire project will be delayed. Graphic Planning/Scheduling/Control Tools (cont’d)
 in process. Time: estimated weighted times for completion of an activity—optimistic, most likely, and pessimistic. Critical path: the most time consuming (longest) chain of required activities and events in a PERT network that must be completed on time or else the entire project will be delayed. Graphic Planning/Scheduling/Control Tools (cont’d).")
35
Copyright © Houghton Mifflin Company. All rights reserved.Lecture Outline and Line Art Presentation, 6–35 Formula for Calculating Estimated PERT Times Graphic Planning/Scheduling/Control Tools (cont’d)
.")
36
Copyright © Houghton Mifflin Company. All rights reserved.Lecture Outline and Line Art Presentation, 6–36 Positive and Negative Aspects of PERT Excellent scheduling tool for large, nonroutine projects. Requires envisioning projects in their entirety. Provides a tool for predicting resource needs, potential problem areas, and the effect of delays. Inappropriate for repetitive assembly-line operations. Only as good as its underlying assumptions about event completion times. Can be too time consuming if not computerized. Graphic Planning/Scheduling/Control Tools (cont’d)
.")
37
Copyright © Houghton Mifflin Company. All rights reserved.Lecture Outline and Line Art Presentation, 6–37 Figure 6.9 A Sample PERT Network

38
Copyright © Houghton Mifflin Company. All rights reserved.Lecture Outline and Line Art Presentation, 6–38 Break-Even Analysis Break-Even Point The level of sales at which there is no loss or profit. The point at which the total of fixed and variable costs is equal to total sales revenues. Fixed Versus Variable Costs Fixed costs: contractual costs that must be paid regardless of output or sales. Variable costs: costs that vary directly with production and sales.

39
Copyright © Houghton Mifflin Company. All rights reserved.Lecture Outline and Line Art Presentation, 6–39 Break-Even Analysis (cont’d) The Algebraic Method FC = total fixed costs P = selling price (per unit) VC = variable costs (per unit) BEP = breakeven point (in units) The difference between unit selling price P and unit variable costs VC is the contribution margin that can be applied to recovering fixed costs.
 The Algebraic Method FC = total fixed costs P = selling price (per unit) VC = variable costs (per unit) BEP = breakeven point (in units) The difference between unit selling price P and unit variable costs VC is the contribution margin that can be applied to recovering fixed costs..")
40
Copyright © Houghton Mifflin Company. All rights reserved.Lecture Outline and Line Art Presentation, 6–40 Break-Even Analysis (cont’d) Price Planning Determining the impact of changes in unit selling price on the breakeven point in units. Rising prices decrease the breakeven point, lower prices increase the breakeven point.
 Price Planning Determining the impact of changes in unit selling price on the breakeven point in units. Rising prices decrease the breakeven point, lower prices increase the breakeven point..")
41
Copyright © Houghton Mifflin Company. All rights reserved.Lecture Outline and Line Art Presentation, 6–41 Break-Even Analysis (cont’d) Profit Planning Determining the required level of output to achieve a profit objective. VCP FC BEP profitdesired )unitsin(000,20 47 000,30000,30 )unitsin( BEP
 Profit Planning Determining the required level of output to achieve a profit objective. VCP FC BEP profitdesired )unitsin(000, ,30000,30 )unitsin( BEP.")
42
Figure 6.10 Graphic Break- Even Analysis

43
Copyright © Houghton Mifflin Company. All rights reserved.Lecture Outline and Line Art Presentation, 6–43 Break-Even Analysis: Strengths and Limitations Uses of Break-Even Analysis Forces planners to interrelate cost, volume, and profit in a realistic way. Allows planners to ask what-if questions concerning the impact of price, costs, and profit objective changes. It is difficult to achieve a neat separation of fixed and variable costs. Complex factors in supply and demand interfere with the linear projections (point estimates) of the analysis.
 of the analysis..")
Similar presentations