Download presentation
Presentation is loading. Please wait.

1
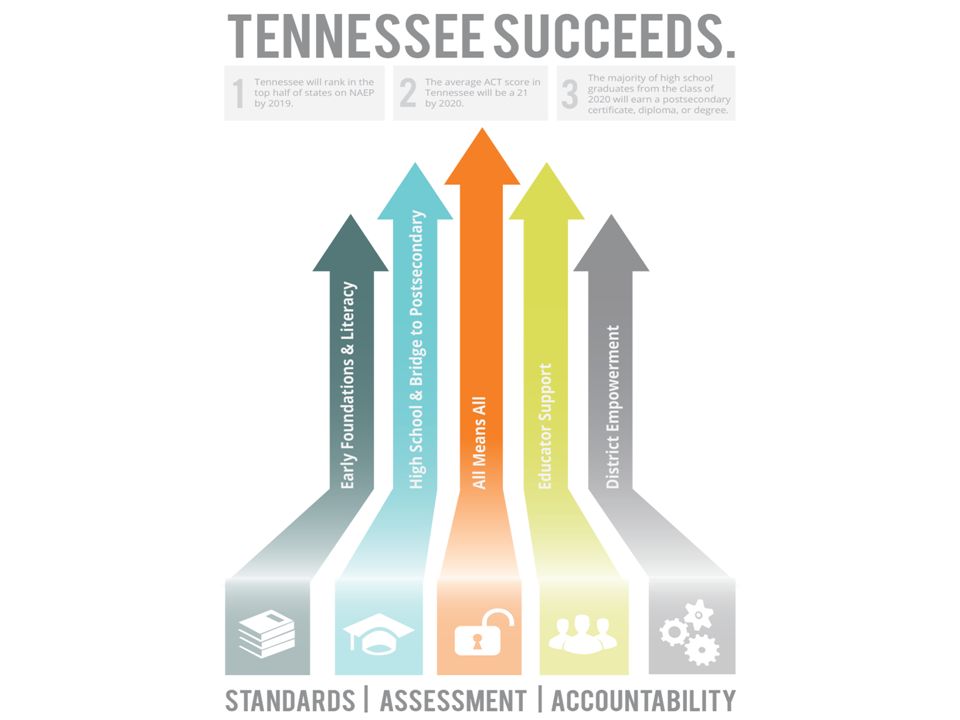
TENNESSEE SUCCEEDS.

2
In the spring of 2007, the U.S. Chamber of Commerce released an education report card for all states. Tennessee received an “F” in the category of Truth in Advertising when comparing proficiency on Tennessee assessments to National Assessment of Education Progress (NAEP). Tennessee also received an “F” in the category of Postsecondary and Workforce Readiness. CALL TO ACTION.
. Tennessee also received an F in the category of Postsecondary and Workforce Readiness. CALL TO ACTION..")
3
RESPONSE: RAISE STANDARDS INCREASE ACCOUNTABILITY ALIGN ASSESSMENTS 2011–12: Tennessee earns approval for first ESEA waiver and led nation in implementing statewide teacher evaluation model 2012–15: Evaluation model modified each year based on feedback from the field 2015: USED approves Tennessee’s application for four-year waiver renewal 2008: TN adopts higher standards through the Tennessee Diploma Project 2010: State Board unanimously adopts the Common Core State Standards in ELA and math 2013-15: TN completes overhaul of Career and Technical Education (CTE) courses. 2014: Review process for new math and ELA standards begins. 2011–12: Tennessee students begin completing CRA in math, applying multiple skills to solve a problem 2014–15: All students in grades 3-11 took writing assessment and social studies field test online 2015–16: First year of TNReady!

4
SUCCESSES TO DATE Fastest improving state in the nation on 4 th and 8 th grade NAEP Consistent gains on TCAP every year since new assessments in 2010 Fastest growing graduation rate of any state ACT statewide average has increased to 19.4 4

5
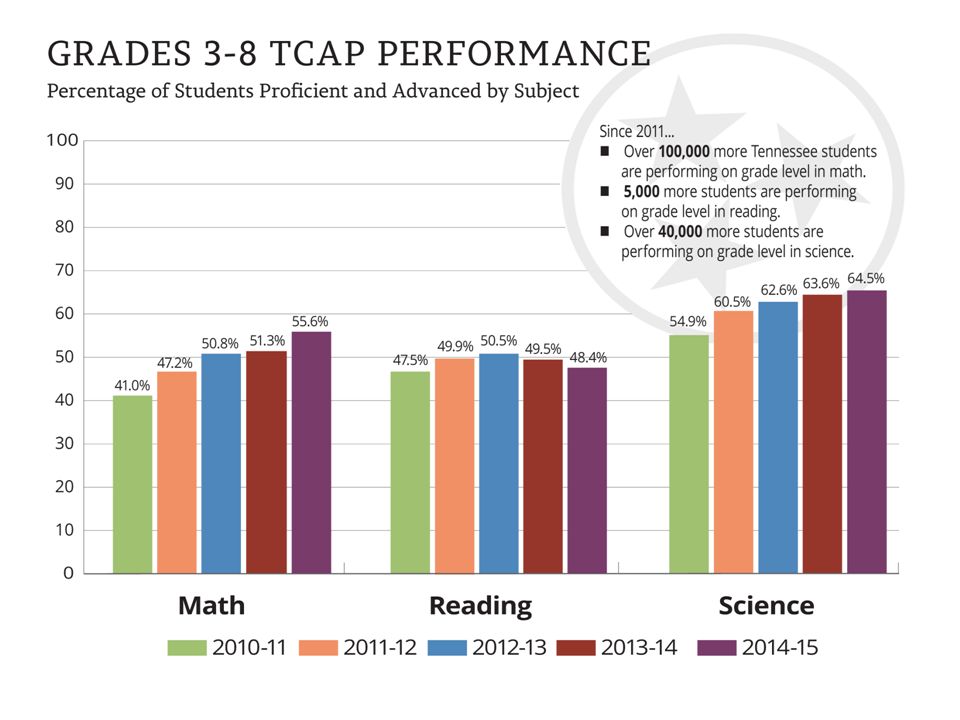
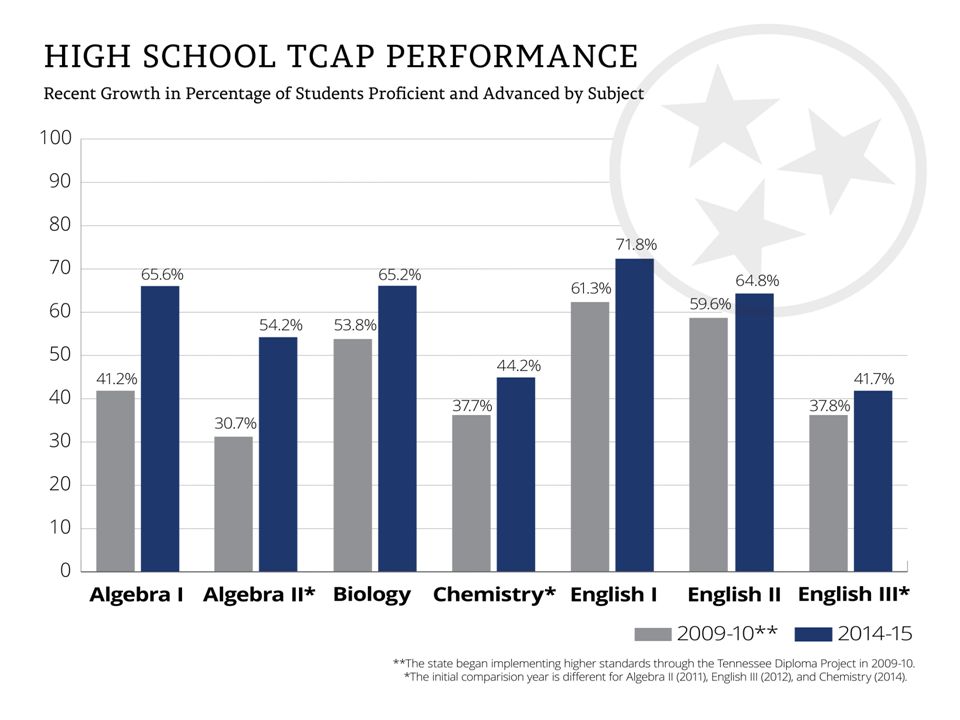
2014-15 TCAP RESULTS:

9
BUT, WE STILL HAVE ROOM TO IMPROVE Less than half of all 3 rd thru 8 th grade students are proficient or above in reading. Tennessee still ranks in the bottom half of all states on the Nation’s Report Card or NAEP. In fall 2014, 43% of high school graduates did not enroll in postsecondary. Almost 60% of first-time freshmen in TN community colleges took at least one remedial or developmental course. Tennessee’s six-year graduation rate is 28% for community colleges and 58% for universities.

10
SUCCESS AFTER GRADUATION 71,403 Students 2008 Cohort of High School Freshmen Students who graduated from high school and entered the workforce and earn an average salary of $9,161 annually, far below the poverty line. Only 6 percent of students who were enrolled after one year completed a degree or certificate within two years.

11
OUR VISION Districts and schools in Tennessee will exemplify excellence and equity such that all students are equipped with the knowledge and skills to successfully embark upon their chosen path in life.

13
OUR GOALS Tennessee will continue rapid improvement and rank in the top half of states on the Report Card. MEASUREMENT Tennessee will rank in top half of states on 4 th and 8 th grade NAEP in 2019. 1

14
GOAL 1 READING

15
GOAL 1 MATH

16
OUR GOALS Tennessee will continue rapid improvement and rank in the top half of states on the Report Card. MEASUREMENT Tennessee will rank in top half of states on 4 th and 8 th grade NAEP in 2019. 1 2 The average ACT score in Tennessee will be a 21, allowing more students to earn HOPE scholarships. MEASUREMENT Tennessee will have an average public ACT composite score of 21 by 2020.

17
GOAL 2

18
OUR GOALS Tennessee will continue rapid improvement and rank in the top half of states on the Report Card. MEASUREMENT Tennessee will rank in top half of states on 4 th and 8 th grade NAEP in 2019. 1 2 3 The average ACT score in Tennessee will be a 21, allowing more students to earn HOPE scholarships. MEASUREMENT The class of 2020 will be on track to achieve 55% postsecondary completion in six years. The majority of Tennessee high school graduates will earn a certificate, diploma, or degree. MEASUREMENT Tennessee will have an average public ACT composite score of 21 by 2020.

19
GOAL 3

20
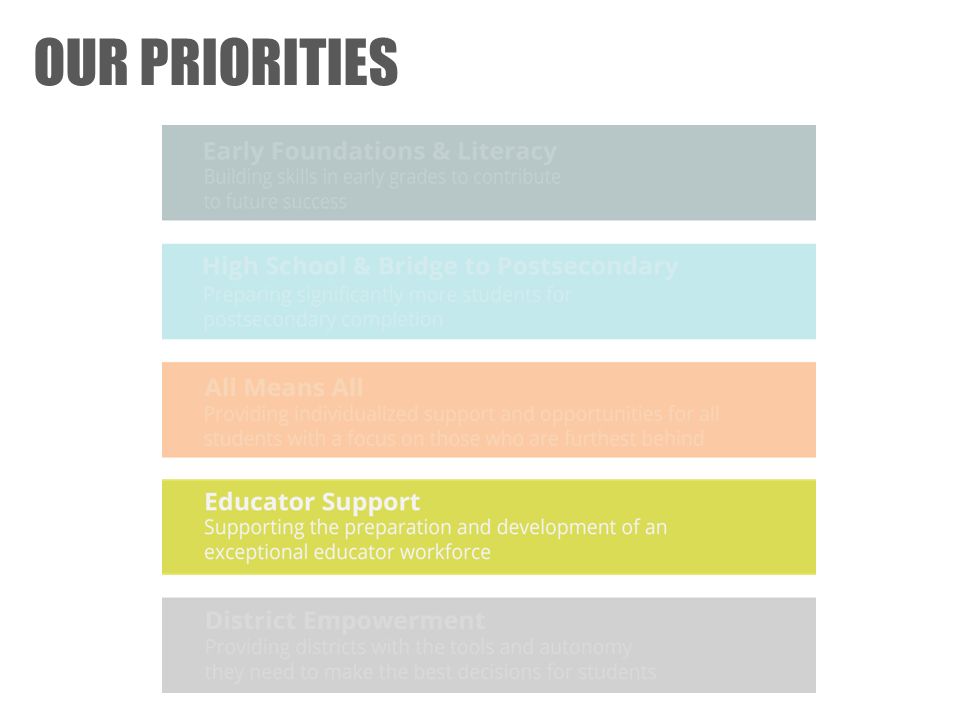
OUR PRIORITIES

22
Over the past several years, we have seen steady gains in math performance in grades 3-5; however, English language arts performance has remained stagnant or declined. Statewide assessments to measure student learning do not begin until grade 3. Of almost 6,000 Tennessee students rated below basic in third grade English language arts, less than 3 percent reach proficiency by fifth grade. For many students, early intervention is a key element of later outcomes. National data show that children who are not reading proficiently by third grade are four times less likely than their peers to graduate high school by age 19. EARLY FOUNDATIONS & LITERACY WHY THIS MATTERS

23
EARLY FOUNDATIONS & LITERACY WHY THIS MATTERS

24
EARLY FOUNDATIONS & LITERACY Rather than focusing on short-cycle improvements, we have a long-term plan to confront lack of progress in early grades reading and writing across the state. Two specific initiatives: Ready to Read and Read to be Ready Implementing effective screening and high-quality interventions in early grades Continued trainings to target teacher knowledge of best practices Developing an academic coach network across the state to share effective strategies and provide on-the-job teacher training

25
SHOWING WHAT IS POSSIBLE: POLK COUNTY The goal of Benton Elementary School’s pre-K program in Polk County is to reduce the number of struggling readers. The school has two pre-K classrooms that serve 40 children. The program is sensitive to the social growth of four-year olds while immersing them in a literacy- rich environment. BES pre-K has set seven specific literacy goals for each child to meet and integrates literacy in all learning centers. Results to date: Data on the impact of BES pre-K is powerful: 87 percent of BES pre-K students scored 70 or higher on a early literacy exam, while less than 25 percent of non-BES pre-K students scored 70 or higher.

26
SHOWING WHAT IS POSSIBLE: DAVIDSON COUNTY Casa Azafran Early Learning Center is a preschool serving 80 four-year-olds in Davidson County which opened its doors in 2014-15. More than half of Casa’s students are non-native English speakers, and 85 percent are economically-disadvantaged. Results to date: After nine months in pre-K, 70 percent of non-native English speaking students at Casa required no English-learner services in kindergarten. Focused on both serving families and providing a high-quality early learning experience for students Located with a community center housing 10 local non-profits Focused small group literacy work, centers, music and movement, gardening, and daily routines and rituals

27
SHOWING WHAT IS POSSIBLE: LEBANON SPECIAL SCHOOL DISTRICT Lebanon Special School District (LSSD) has crafted a literacy initiative that is already going the distance. Results to date: Literacy growth score of 5 district wide Four schools scored a 5, and two schools scored a 4 in school-wide literacy growth. LSSD ranked 15 out of 142 districts in literacy growth Early literacy focus in pre-K to second grade Reading teacher specialists in each school in grades 2-3 In K-8: (1) instructional coaches in every school, (2) intervention/enrichment every day on skill or standard weaknesses, (3) software to support literacy practice, (4) literacy task lessons weekly
 instructional coaches in every school, (2) intervention/enrichment every day on skill or standard weaknesses, (3) software to support literacy practice, (4) literacy task lessons weekly.")
28
SHOWING WHAT IS POSSIBLE: LAUDERDALE COUNTY In Lauderdale County, 78 percent of students are economically disadvantaged, and the district has struggled to meet postsecondary and workforce readiness benchmarks. LCSD leaders made a commitment to improve literacy rates and future outcomes of students by initiating the Extended Literacy Initiative (ELI) in pre-K to third grade. Results to date: Significant increases in mean NCEs for all grade levels on SAT-10 and growth in 99 th percentile on 3 rd grade TCAP ELA. Driven by a variety of formative and summative student data Students receive 90–240 minutes of intensive literacy instruction per day Innovative scheduling allows for explicitly prescriptive instruction Daily rotation through extension labs and literacy stations utilizing leveled text to optimize student learning
 in pre-K to third grade. Results to date: Significant increases in mean NCEs for all grade levels on SAT-10 and growth in 99 th percentile on 3 rd grade TCAP ELA. Driven by a variety of formative and summative student data Students receive 90–240 minutes of intensive literacy instruction per day Innovative scheduling allows for explicitly prescriptive instruction Daily rotation through extension labs and literacy stations utilizing leveled text to optimize student learning.")
29
OUR PRIORITIES

31
If we allow current trends to continue, only 24 percent of high school graduates will earn a postsecondary certificate or degree within six years of their high school graduation. Among students from the graduating class of 2015, only half of the 12 percent that took Advanced Placement tests for early postsecondary credit earned a passing score. Less than half of students who completed a Tennessee Promise application, which would qualify them for free attendance at any Tennessee community college or TCAT, fulfilled all requirements to qualify for the scholarship. HIGH SCHOOL & BRIDGE TO POSTSECONDARY WHY THIS MATTERS

32
HIGH SCHOOL & BRIDGE TO POSTSECONDARY WHY THIS MATTERS

33
HIGH SCHOOL & BRIDGE TO POSTSECONDARY As a state, we recognize that high school graduation cannot be the end goal and that students need experiences in high school that directly translate into postsecondary options. Greater student access to quality early postsecondary opportunities and industry certifications Develop a common definition of postsecondary and workforce readiness for students, parents, and schools Focus on counselors to ensure that students receive meaningful information about the steps needed to set and achieve postsecondary goals

34
SHOWING WHAT IS POSSIBLE: TULLAHOMA CITY Increased access to Chrome books so students who did not have easy access to the internet had greater opportunity for ACT prep Increased focus on AP enrollment In the 2010 cohort, Tullahoma had 33 percent of its students take an AP exam, while the average district has about 9 percent take an AP exam. Increased rigor across all courses so students are receiving instruction that prepares them to meet the ACT benchmarks Results to date: This year, Tullahoma City Schools posted the largest ACT gains in the state, raising their average composite by two points to a 22.4.

35
SHOWING WHAT IS POSSIBLE: HAWKINS COUNTY Clinch School in Hawkins County is a small, rural school that has a history of high drop-out rates, but they are quickly turning around that statistic. The college-going culture begins in 6 th grade with yearly college tours. Thanks to the work of the school counselors, every student fills out the FAFSA and stays on top of application deadlines. Because of how isolated Clinch is, the school has opened up doors to online classes and distance learning, so students are not limited in access to quality classes because of location. Results to date: Principal George Barton, in partnership with both the school and college counselor, have made sure that in the last five years, at least 90 percent of graduating seniors have gone on to postsecondary.

36
OUR PRIORITIES

38
We cannot improve outcomes overall without improving outcomes for our historically underserved subgroups: economically disadvantaged, Black-Hispanic-Native American, English learners, or students with disabilities. While average student performance has risen in past years, we continue to see substantial achievement gaps between students in historically underserved subgroups and their comparison groups. In grades 3-8, nearly 35,000 of the 450,000 students – 8 percent – tested below basic in both math and English language arts. All but 2,000 of these students fall into one of our four historically underserved subgroups. ALL MEANS ALL WHY THIS MATTERS

39
Achievement Gaps Grades 3-8 English Language Arts Percent of students who are proficient or advanced ALL MEANS ALL WHY THIS MATTERS

40
ALL MEANS ALL As a state, we are committed to the success of all students. Our work in this area involves providing individualized support and opportunities for all students, with a specific focus on those who are furthest behind. Enhanced support with sharing best practices for RTI 2 in specific grade levels Pilot programs for personalized learning opportunities that support both students who are behind needing remediation and students who are advanced needing acceleration Address systemic gaps in different student groups’ access to highly effective teachers

41
SHOWING WHAT IS POSSIBLE: RUTHERFORD COUNTY Built district plan around the work of the PLC and providing the right targeted intervention to all students in need Accountability so all schools have intervention times built into schedules Strong focus on training school teams to ensure clarity of roles and responsibilities in implementation of RTI 2 On-going support to schools by the district’s RTI 2 team around planning, data analysis, and effective interventions Rutherford County has placed an impressive focus on the implementation of RTI 2 and the results for students show the power of intervention. Below are a few of the strategies Rutherford has utilized: Results to date: Strong growth in reading and math on TCAP for both elementary and middle school students who received tiered intervention.

42
Average NCE Growth – Middle Schools Tier II and III Students Only SHOWING WHAT IS POSSIBLE: RUTHERFORD COUNTY

43
OUR PRIORITIES

45
Since 2010, 15,000 educators have entered Tennessee public schools through 40 state-approved preparation programs. Improving teaching across the state will require improving teacher preparation. Nearly one-third of Tennessee teachers have less than five years of teaching experience, and 7 percent are in their first year on the job. The percentage of teachers who say the process of teacher evaluation improves their teaching has risen steadily to 68 percent of educators since the introduction of a new statewide evaluation system in 2012. EDUCATOR SUPPORT WHY THIS MATTERS

46
EDUCATOR SUPPORT WHY THIS MATTERS How would you rate the amount of each of the following resources in your school? Percent of teachers who rate resources as “adequate”

47
EDUCATOR SUPPORT: TEACHER PREPARATION Achieving our goals will require a tremendous amount from our teachers. Roughly one-fifth of teachers in the state are in their first through third-year in the classroom. We believe we can do more to ensure that the candidates you receive from our teacher prep institutions are classroom-ready. Rigorous accreditation process for educator preparation programs that focus on outputs Feedback from employers about the strength of candidates that will figure directly into the program accreditation process New sources of public data about the strengths and weaknesses of educator preparation programs in order to drive their improvement and to help candidates make informed decisions about the program they choose

48
SHOWING WHAT IS POSSIBLE: MEMPHIS TEACHER RESIDENCY In 2009, Memphis Teacher Residency and Union University began partnering to design coursework that aligned theory and practice in order to meet the needs of Memphis students and teachers. Program participants complete a one-year internship in a high-need school in Memphis with a mentor teacher and receive instructional coaching by many of the same professors who teach the graduate coursework. MTR has 236 educators in 31 Memphis schools, 69 of whom are current residents in the program Results to date: Analysis of effect scores the Report Card indicates that MTR is one of the top five preparation programs, consistently producing teachers who are outperforming other teachers in the state.

49
EDUCATOR SUPPORT: SCHOOL LEADER PREPARATION Research shows that strong leadership impacts student performance. There are virtually no documented instances of low-performing schools being turned around without the intervention of a powerful leader. Knowing that roughly a quarter of principals in Tennessee turnover each year, we must address our issues around leadership pipeline. Develop a transformational leadership advisory council Support and develop regional transformational school leadership hubs Launch the Governor’s Academy for School Leadership (GASL) which will impact districts statewide.
 which will impact districts statewide..")
50
SHOWING WHAT IS POSSIBLE: LEADERSHIP PREPARATION PROGRAMS UT-Knoxville Leadership Academy Governor’s Academy for School Leadership (GASL) Ayers Leadership Fellows Program
 Ayers Leadership Fellows Program")
51
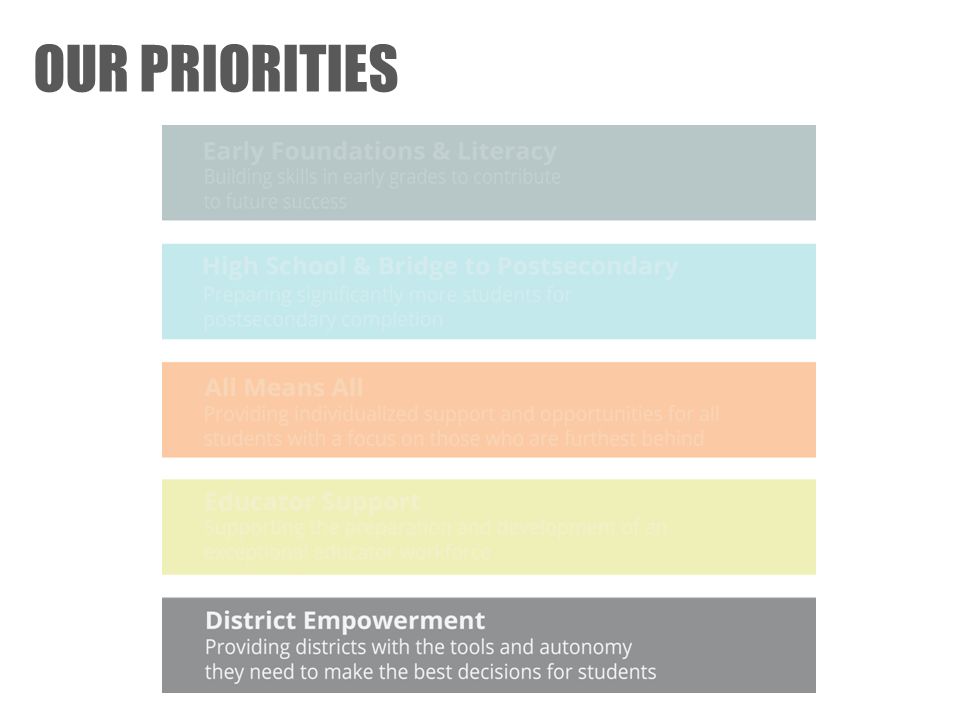
OUR PRIORITIES

53
DISTRICT EMPOWERMENT WHY THIS MATTERS Serving the state means serving a diverse group of 142 districts. We cannot achieve our collective goals without building flexibility and district ownership into all that we do. There is no one-size-fits- all model. The department actively measures ongoing progress to ensure a department orientation toward empowerment rather than compliance. Currently, 25 districts are using an alternative, district-selected model for teacher evaluation, and 114 districts are making use of state-provided evaluation support tools. Over a hundred districts have integrated with the state data system to allow real-time educator dashboards and fully-automated state reporting.

54
DISTRICT EMPOWERMENT WHY THIS MATTERS Tennessee School Districts By Student Enrollment Numbers

55
DISTRICT EMPOWERMENT Ideas worth replicating and spreading have started in our schools and classrooms—not at the state. We are committed to providing districts with the autonomy they need to best serve their students. Increased delivery of actionable data to our districts and schools Simplified technology platforms that support and automate district work Greater access to innovative tools that will allow educators to deliver compelling adaptive instruction Networked improvement communities to promote district innovation and idea-sharing

56
The First Tennessee CORE region has been a leader in innovation and networking. The 17 districts that make up First TN have focused on collaboration in an effort to expose their students to strong instruction and content. The following are two notable strategies from First TN: SHOWING WHAT IS POSSIBLE: FIRST TENNESSEE Aligned professional learning days so teachers across the region can come together to collaborate on their content areas. This allows teachers, who are often the only teacher of a certain content area in their district, to have access to collaboration and resources. Provided virtual courses so that students could take a course in another district even if their school did not provide it. For example, students in Johnson City had the opportunity to take German from a teacher in Unicoi County without leaving their school. Sullivan County offered a French class that was full of Greene County students.

57
HOW WILL TENNESSEE SUCCEED?

58
TENNESSEE WILL SUCCEED WHEN YOU SUCCEED. Your leadership is key. Your teacher leadership is key. Your community is key.

59
TENNESSEE WILL SUCCEED WHEN YOUR STUDENTS SUCCEED. Students must be met where they are. Students must be engaged to achieve. Students must be Promise Ready.

60
HOW WILL YOU LEAD THIS VISION? How will you align? How will you communicate? How will you inspire?

61
QUESTIONS?

Similar presentations