Download presentation
Presentation is loading. Please wait.

1
APES 1.Get out notebook paper – NO SPIRAL FRINGE 2.Everything else away except a writing utensil.

2
Nonrenewable Energy Ch. 15

3
What types of energy do we use? 1.Direct SOLAR ENERGY 2.Indirect SOLAR ENERGY 3.COMMERCIAL ENERGY

4
1. DIRECT SOLAR ENERGY Photovoltaic Cells Solar Thermal

5
2. INDIRECT SOLAR ENERGY Biofuels Wind turbines Hydroelectric dams

6
3. COMMERCIAL ENERGY From nonrenewable resources Extracting/burning nonrenewable resources (FOSSIL FUELS)
.")
7
Energy Use: World & US

8
Energy Use WORLD 85% Nonrenewable Use of coal Use of oil Nuclear leveled off Developing countries depend on biomass (fulewood, charcoal) for heating/cooking – can’t afford fossil fuels US 93% Nonrenewable World’s largest energy user 5% of world’s population uses 25% of world’s energy
 for heating/cooking – can’t afford fossil fuels US 93% Nonrenewable World’s largest energy user 5% of world’s population uses 25% of world’s energy")
9
FOSSIL FUELS * Composed of partially decayed organism remains Nonrenewable Form too slowly to replenish NOT sustainable EX: Coal, Oil, Natural Gas

10
Fossil Fuels OIL, NATURAL GAS, & COAL Oil and gas are less dense than coal Move upward through porous rock and become trapped

11
Formation of Fossil Fuels Formation of Coal - Over time, plants die, covered by water and sediment - Heat and pressure convert material into carbon rich ore (COAL) and sedimentary rock. Formation of Oil Death and buildup of microscopic aquatic organisms. Heat and Pressure convert material to hydrocarbons (OIL) without oxygen in sediments that prevent decay. Formation of Natural Gas Same as oil, just produced at higher temperatures than oil.
 without oxygen in sediments that prevent decay. Formation of Natural Gas Same as oil, just produced at higher temperatures than oil..")
12
FOSSIL FUELS Developed countries consume 8x MORE energy than developing countries

13
What is Net Energy and why is it important? Net energy is the amount of high-quality energy available from an energy resource minus the amount of energy needed to make it available. Net Energy = Total amount of useful energy available Energy needed to make it available -

14
Basic Science: Net Energy is the only energy that really counts First law of thermodynamics: –It takes high-quality energy to get high- quality energy –Pumping oil from ground, refining it, transporting it Second law of thermodynamics –Some high-quality energy is wasted at every step

15
Net Energy Ratio Energy Produced : Energy Used to Produce it Net Energy Ratio, Net Energy Conventional Oil = HIGH net energy ratio, But decreasing

16
Fig. 15-3a, p. 373 Space Heating Passive solar5.8 Natural gas4.9 Oil4.5 Active solar 1.9 Coal gasification 1.5 Electric heating (coal-fired plant) 0.4 Electric heating (natural-gas-fired plant) 0.4 Electric heating (nuclear plant) 0.3
 0.4 Electric heating (natural-gas-fired plant) 0.4 Electric heating (nuclear plant) 0.3.")
17
Fig. 15-3b, p. 373 High-Temperature Industrial Heat Surface-mined coal 28.2 Underground- mined coal 25.8 Natural gas 4.9 Oil 4.7 Coal gasification 1.5 Direct solar (concentrated) 0.9
 0.9.")
18
Fig. 15-3c, p. 373 Transportation Natural gas4.9 Gasoline (refined crude oil) 4.1 Biofuel (ethanol)1.9 Coal liquefaction1.4 Oil shale1.2
 4.1 Biofuel (ethanol)1.9 Coal liquefaction1.4 Oil shale1.2.")
19
Net Energy Energy sources with low/negative net energy cannot compete in open markets with alternatives that have higher net energy yields EX. Nuclear power Need subsidies from taxpayers

20
Reducing Energy Waste Improves Net Energy Yields and Can Save Money 84% of all commercial energy used in the U.S. is wasted –43% after accounting for second law of thermodynamics Drive efficient cars, not gas guzzlers Make buildings energy efficient

21
In 2008: Energy Use in US Comprised of Oil 40% Natural Gas 23% Coal 20% Nuclear Power 8% Hydropower 3% Biomass 3% Geothermal, 1% Solar & wind

22
We depend heavily on oil Petroleum or crude oil Composed of various hydrocarbons Produced by decomposition of dead organic matter from plants/animals

23
Oil Recovery

24
We depend heavily on oil Peak production: time after which production from a well declines –Global peak production for all world oil

25
Oil Extraction & Refining By boiling point temperature Lowest Boiling Point Gases Gasoline Aviation fuel Heating oil Diesel oil Naphtha Heated crude oil Grease and wax Furnace Asphalt Highest Boiling Point

26
Petrochemicals Raw materials used in manufacturing

27
How long might conventional supplies of oil last? SHORT ANSWER = ??????? Rapid increase of use since 1950 Largest consumers in 2009 –United States, 23% –China, 8% –Japan, 6%

28
How long might conventional supplies of oil last? Proven oil reserves –Identified deposits that can be extracted profitably with current technology Unproven reserves –Probable reserves: 50% chance of recovery –Possible reserves: 10-40% chance of recovery Proven and unproven reserves will be 80% depleted sometime between 2050 and 2100

29
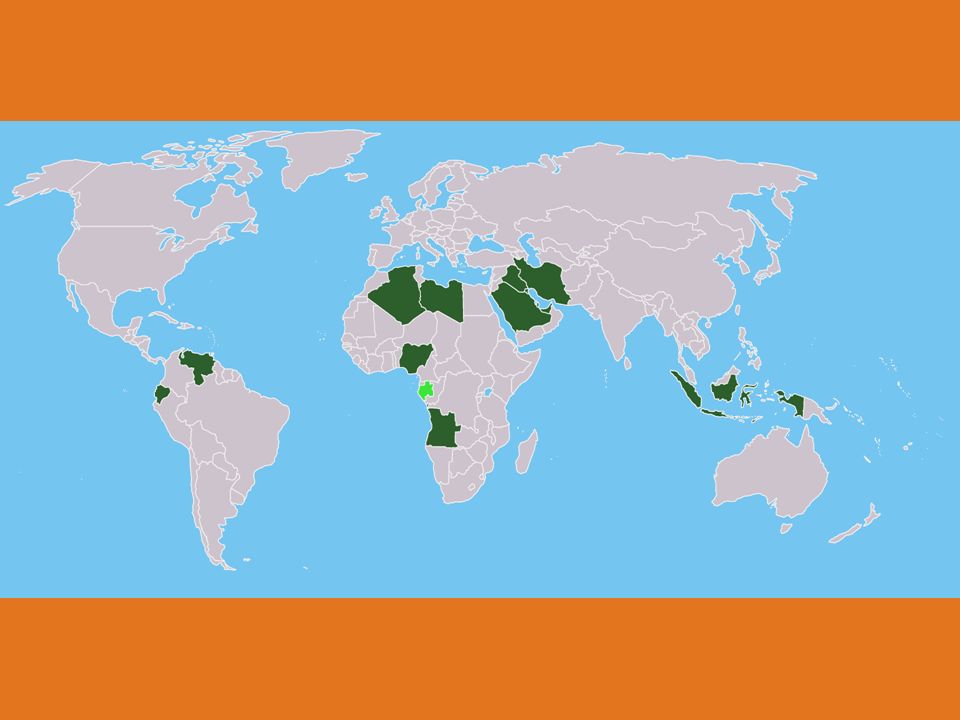
OPEC Controls Most of the World’s Oil Supplies Organization of Petroleum Exporting Countries (OPEC) 13 countries have at least 60% of the world’s crude oil reserves –Saudi Arabia: 20% –United States: 1.5% Global oil production leveled off in 2005
 13 countries have at least 60% of the world’s crude oil reserves –Saudi Arabia: 20% –United States: 1.5% Global oil production leveled off in 2005")
31
The United States Uses Much More Oil Than it Produces Produces 9% and Uses 23% 1.5% of World’s Proven Oil Reserves – most in Environmentally sensitive areas Import 52% of our oil for $ 200 billion

32
What are our options? 1.Look for more oil 2.Use less oil 3.Waste less oil 4.Use other energy sources

33
Oil to be Found 1.Conventional oil: smaller, dispersed, and harder to find 2.Heavy oil from existing wells 3.Unconventional Oil – Tar sands & oil shales $$$$$$ & Low Net Energy

34
Proven & Unproven Reserves in N. America

35
Bakken Oil Formation Under parts of Montana, S. Dakota, N. Dakota, & Canada 2008 U.S. Geological Survey Projections over next 20 years -10% of estimated conventional & unconventional oil in unproven reserves could be removed -Low net energy -High environmental costs -New oil meet current U.S. needs for only 1 year.

36
Arctic National Wildlife Refuge Fragile Arctic Tundra –Extremely cold/dry conditions –Short growing season –Permafrost –Shallow/nutrient poor soils –Slow Growth/decomposition rates –Specialized species –Low biodiversity How would drilling affect this ecosystem?

37
Crude Oil in the Arctic National Wildlife Refuge Fig. 15-5, p. 376

38
ANWR Crude oil that might be found tiny fraction of U.S. Oil Consumption Would take 10 – 20 years to develop this oil supply Only lower gas prices by 6 cents/gallon

39
ANWR ANWR meet current world demand for only 1 – 5 months and U.S. demand for 7 – 24 months

40
The United States cannot even come close to meeting its huge and growing demand for crude oil and gasoline by increasing domestic supplies. U.S. Energy Consumption by Fuel

41
Fig. 15-6, p. 377 Trade-Offs Conventional Oil AdvantagesDisadvantages Ample supply for several decades Water pollution from oil spills and leaks High net energy yield but decreasing Environmental costs not included in market price Low land disruption Releases CO 2 and other air pollutants when burned Efficient distribution system Vulnerable to international supply interruptions

42
3 caveats when evaluating future oil supplies 1. Potential reserves are not proven reserves 2. Must use net energy yield to evaluate potential of any oil deposit 3. Must take into account high global use of oil

43
Natural Gas Mixture of gases 50 -90% Methane (CH 4 ) Versatile with high net energy
 Versatile with high net energy")
44
Natural Gas Uses Heat space & water Produce electricity

45
What are the advantages & disadvantages to using Natural Gas? -more plentiful than oil -has a high net energy yield -fairly low cost -lowest environmental impact of all fossil fuels.

46
Formation of Natural Gas Same as oil, just produced at higher temperatures Conventional natural gas – lies above most reservoirs of crude oil

47
Conventional Natural Gas –Pipelines –Liquefied petroleum gas (LPG) –Liquefied natural gas (LNG) Low net energy yield Makes U.S. dependent upon unstable countries like Russia and Iran

48
Coal Solid fossil fuel Burned in power plants (inefficient)
")
49
What are the advantages & disadvantages of using coal? -Plentiful -high net energy yield -low cost -very high environmental impact.

50
What are the advantages & disadvantages of coal? Gaseous and liquid fuels produced from coal -could be plentiful -have lower net energy yields -higher environmental impacts than conventional coal has.

51
Coal is a plentiful, but dirty fuel World’s most abundant fossil fuel –US = 28% of proven reserves Environmental costs of burning coal –Severe air pollution Sulfur released as SO 2 Large amount of soot CO 2 Trace amounts of Hg and radioactive materials

52
Coal Formation

53
Increasing moisture content Increasing heat and carbon content Peat (not a coal) Lignite (brown coal) Bituminous (soft coal) Anthracite (hard coal) Heat Pressure Partially decayed plant matter in swamps and bogs; low heat content Low heat content; low sulfur content; limited supplies in most areas Extensively used as a fuel because of its high heat content and large supplies; normally has a high sulfur content Highly desirable fuel because of its high heat content and low sulfur content; supplies are limited in most areas Stepped Art Fig. 15-14, p. 382 Stages in Coal Formation

54
How do coal power plants produce energy? Fig. 15-15, p. 382

55
CO 2 Emissions Per Unit of Electrical Energy Produced for Energy Sources Fig. 15-17, p. 383

56
Coal AdvantagesDisadvantages Ample supplies in many countries Severe land disturbance and water pollution Fine particle and toxic mercury emissions threaten human health High net energy yield Emits large amounts of CO 2 and other air pollutants when produced and burned Low cost when environmental costs are not included Trade-Offs

57
The clean coal & anti-coal campaigns Coal companies and energy companies fought –Classifying carbon dioxide as a pollutant –Classifying coal ash as hazardous waste –Air pollution standards for emissions 2008 clean coal campaign –But no such thing as clean coal “Coal is the single greatest threat to civilization and all life on the planet.” – James Hansen

58
Solutions for “Clean Coal” 60 Minutes : Clean Coalhttp://www.youtube.com/watch?v=Z94VIGa Xxho&feature=relatedhttp://www.youtube.com/watch?v=Z94VIGa Xxho&feature=related http://www.youtube.com/watch?v=BgOEQLqPk uY&feature=fvwrelhttp://www.youtube.com/watch?v=BgOEQLqPk uY&feature=fvwrel

59
Solutions for “Cleaner Coal” Install Scrubbers (Desulfurization systems) Used to clean power plant exhaust Chemicals in scrubber react with pollution causing it to precipitate out EXPENSIVE, but EFFECTIVE
 Used to clean power plant exhaust Chemicals in scrubber react with pollution causing it to precipitate out EXPENSIVE, but EFFECTIVE")
60
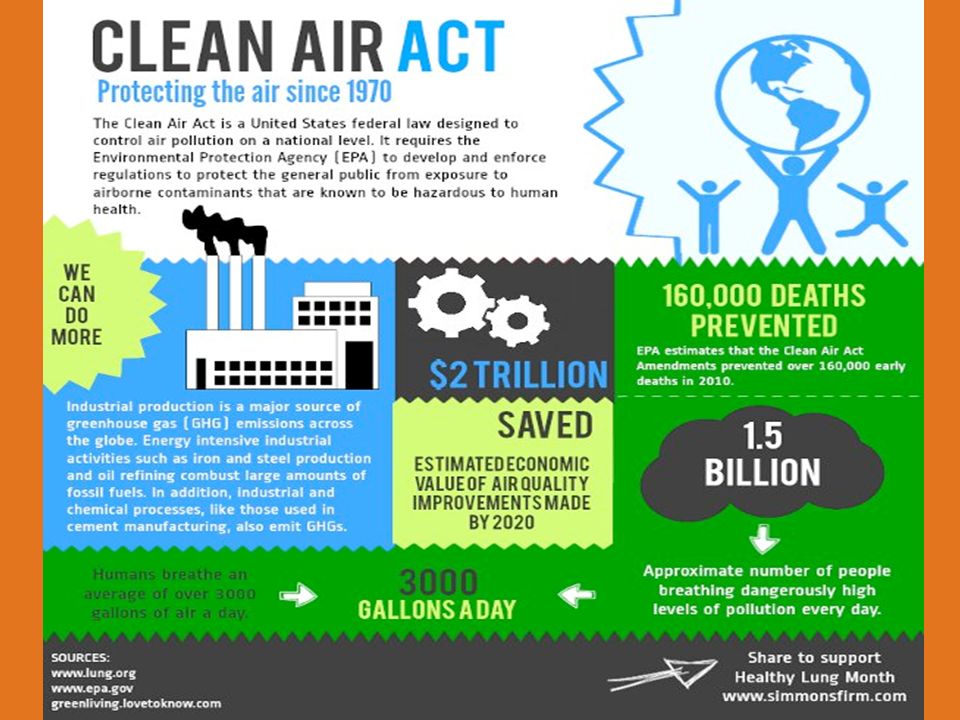
Solutions for “Cleaner Coal” Legislation to reduce emissions -1990 Clean Air Act Amendments -Cut emissions and require installation of scrubbers

62
Solutions for Clean Coal Clean Technology “Clean Coal” EX. Fluidized Bed Combustion mix hot air w/coal and limestone at lower temps NOx produced Sulfur PPTs out Scrubbers not needed Still emits CO 2 gas

63
Burning Coal More Cleanly Fluidized-Bed Combustion Fig. 15-32 p. 364

Similar presentations


>")


