Download presentation
Presentation is loading. Please wait.

1
The Most Important Graph in the World: US Life Cycle Deficits, 1888-2003 Gretchen Donehower UC Berkeley Department of Demography September 27, 2006

2
Talk Outline Quick review of National Transfer Accounts project Introduce concepts, data and methods with current life cycle deficit age profiles (2003) Review life cycle deficits back to 1888 Applications of age profiles and future research directions
 Review life cycle deficits back to 1888 Applications of age profiles and future research directions")
3
National Transfer Accounts (NTA) www.ntaccounts.org National Income and Product Accounts (NIPA) –aggregate stocks and flows in an economy NIPA + age + transfer framework = NTA –who owns the stocks, who creates the flows? –how are flows transferred among individuals? Thanks NIA, thanks Ron!

4
Life Cycle Deficits, 2003

5
Age 29 57

6
Components of Labor Income, 2003

7
Components of Consumption, 2003

8
Data Consumer Expenditure Surveys (CEX) Non-institutional population only, for now Early samples not nationally representative –1888: Industrial workers and their children –1917: Industrial workers and their families Some profiles have to be estimated outside of household surveys –Public education consumption –Government-provided health care consumption
 Non-institutional population only, for now Early samples not nationally representative –1888: Industrial workers and their children –1917: Industrial workers and their families Some profiles have to be estimated outside of household surveys –Public education consumption –Government-provided health care consumption")
9
Missing Institutional Population Missing many elderly in nursing homes, and other institutionalized Their consumption of some things will be lower, others higher Probably not a big income profile impact

10
Methods Two Parts: –Estimate the age shape –Adjust to NIPA “control totals” Age shape estimation: –Direct measurement (earnings) –Consumer weights (most private consumption) –Age regression (private education & health) –Proxy variable (fringe benefits) –External estimates (public education & health)
 –Consumer weights (most private consumption) –Age regression (private education & health) –Proxy variable (fringe benefits) –External estimates (public education & health)")
11
Labor Income and Consumption, 1888-2003 Age Dollars (US, 2000)
")
12
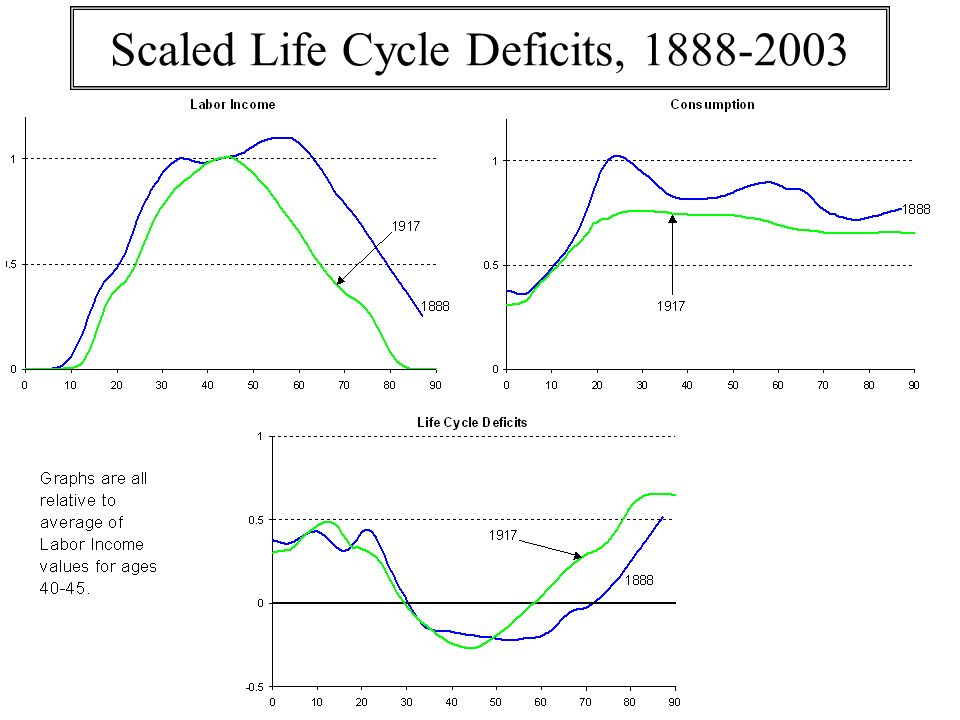
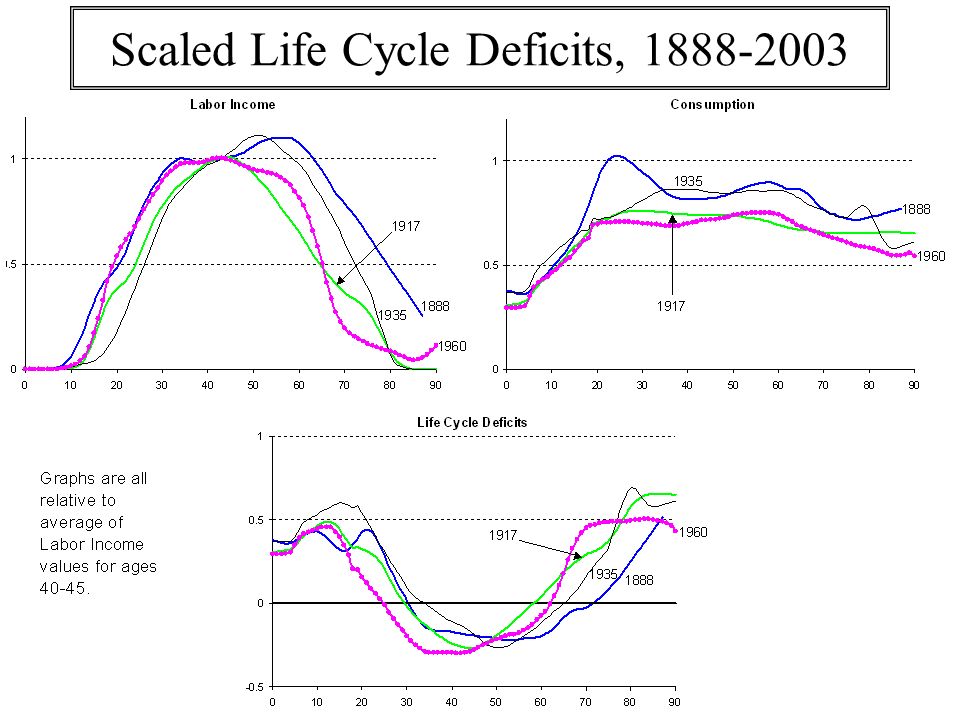
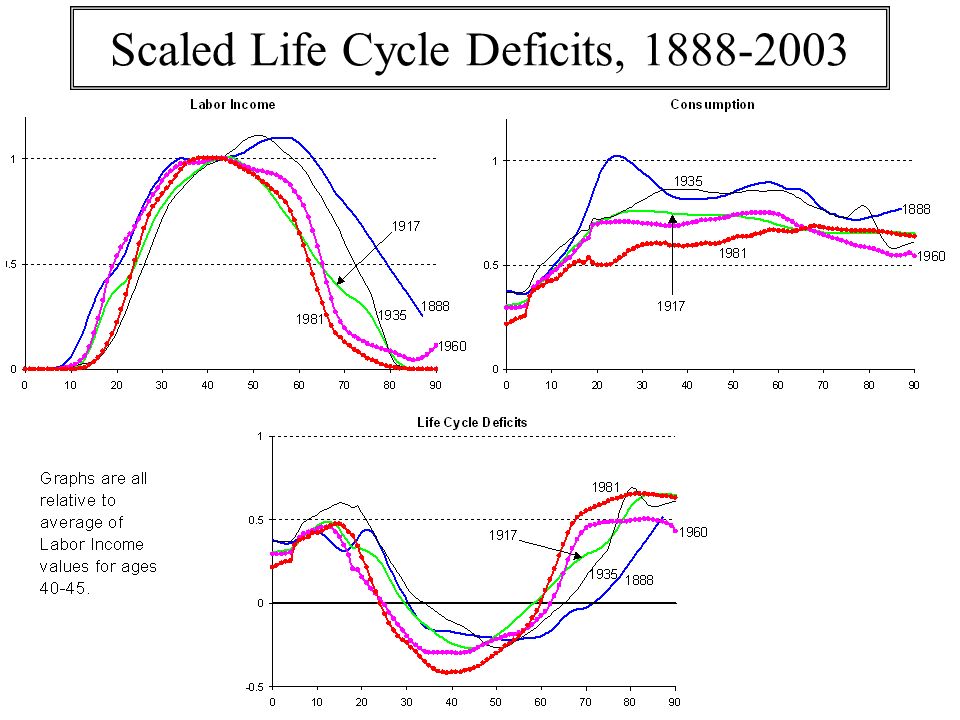
Scaled Life Cycle Deficits, 1888-2003

19
Components of Labor Income

20
Components of Consumption

21
Summary of Changes Young –Size of deficits increased somewhat –Composition changed to more education Old –Consistently larger deficits over time –More health-related consumption, public and private Working Ages –Recently, fewer years making smaller surplus?

22
Summary Measures: Average Age of Profile Constant age distribution (US 1950 is used here) Recent strong increases in average ages of consuming AND producing.
 Recent strong increases in average ages of consuming AND producing.")
23
Summary Measures: Age of Life Cycle Deficit Transitions From first to last age of surplus (labor income > consumption) Recent shrinking of time span to accumulate surplus
 Recent shrinking of time span to accumulate surplus")
24
Paying for the Life Cycle Deficit Since 1929 at least, we have never paid for all of consumption with labor earnings So we must be using capital income and borrowing Even more in recent years?

25
What’s Next? Fine tuning estimates presented today Cross-national comparison Applications of consumption and labor income profiles –Modeling economic change in the context of demographic change (demographic dividends) –Budget projections –How profiles respond to institutional change On to transfers and reallocations! (The really fun stuff…)
 –Budget projections –How profiles respond to institutional change On to transfers and reallocations. (The really fun stuff…).")
Similar presentations


 Amonthep Chawla East-West Center & Nihon University Population Research Institute.>")


