Download presentation
Presentation is loading. Please wait.

1
RESULTS OF THE 2009 ADMINISTRATION OF THE COMMUNITYCOLLEGE SURVEY OF STUDENT ENGAGEMENT Office of Institutional Effectiveness, April 2010

2
Purpose and Description of CCSSE Measures level of students’ engagement with institution which positively relates to learning and retention. Includes 104 content items.

3
Purpose and Description of CCSSE (Cont’d) Seeks information from students about: how they spend their time what they feel they have gained from their classes how they assess their relationships and interactions with faculty, counselors, and peers what kinds of work they are challenged to do how the college supports their learning
 Seeks information from students about: how they spend their time what they feel they have gained from their classes how they assess their relationships and interactions with faculty, counselors, and peers what kinds of work they are challenged to do how the college supports their learning")
4
External Comparison Groups 2009 CCSSE Cohort Colleges Population – all colleges that participated in the 2007- 2009 CCSSE administrations (N=652) 2009 CCSSE Cohort Size Group Comparison Population – all colleges with a student head count enrollment of 15,000 or more that participated in the 2007 – 2009 CCSSE administrations (N=57) 2009 SUNY Consortium – all SUNY colleges (other than SCCC) that participated in the 2009 CCSSE administration (N=28)
 2009 CCSSE Cohort Size Group Comparison Population – all colleges with a student head count enrollment of 15,000 or more that participated in the 2007 – 2009 CCSSE administrations (N=57) 2009 SUNY Consortium – all SUNY colleges (other than SCCC) that participated in the 2009 CCSSE administration (N=28)")
5
SCCC Response Rates SECTIONS – Number of sections surveyed: 97 – Number of sections for which completed surveys were received: 96 – Percent of sections for which surveys were received: 99.0% FACULTY – Number of faculty whose sections were surveyed: 91 – Number of faculty returning completed surveys for their sections: 90 – Percent of faculty returning completed surveys: 98.9% STUDENTS – Number of students in sections surveyed*: 2,480 – Number of completed surveys received: 1,463 – Percent of students completing the survey: 59.0% *Students enrolled in more than one section only counted once. Note: Average response rate for Extra Large Colleges: 53% (High 65%; Low 23%) Average response rate for All Colleges: 51% (High 75%; Low 10%)
 Average response rate for All Colleges: 51% (High 75%; Low 10%).")
6
Comparison of SCCC Survey Participants with All Spring 2009 SCCC Students

7
Comparison of SCCC Survey Participants with All Spring 2009 SCCC Students (Cont’d)
")
8
Comparison of SCCC Survey Participants with External Comparison Groups

9
Comparison of SCCC Survey Participants with External Comparison Groups (Cont’d)
")
10
Mean Item Score Comparisons Item responses converted to numerical scores (e.g., very often=4, often=3, sometimes=2, rarely/ never=1) Mean score for each item computed Compare SCCC respondents’ mean item score with that for comparison groups (All Participating Colleges, Extra Large College Group & SUNY Consortium) Look for differences between SCCC means and the comparison group means that are statistically significant (i.e., cannot be attributed to a sampling artifact) and large enough to merit our attention.
 Mean score for each item computed Compare SCCC respondents’ mean item score with that for comparison groups (All Participating Colleges, Extra Large College Group & SUNY Consortium) Look for differences between SCCC means and the comparison group means that are statistically significant (i.e., cannot be attributed to a sampling artifact) and large enough to merit our attention.")
11
Mean Item Score Comparisons Comparison with All Participating Colleges

12
SCCC Mean Item Scores Above/Below Mean Scores for All Participating Colleges – All Participants

13
SCCC Mean Item Scores Below Mean Scores for All Participating Colleges – All Participants (Cont’d)
")
14
SCCC Mean Item Scores Above/Below Mean Scores for All Participating Colleges – Full-time and Part- time Participants

15
SCCC Mean Item Scores Below Mean Scores for All Participating Colleges – Full-time and Part-time Participants (Cont’d)
")
18
Mean Item Score Comparisons Comparison with Extra Large Colleges

19
SCCC Mean Item Scores Above/Below Mean Scores for Extra Large Colleges – All Participants

20
SCCC Mean Item Scores Above the Mean Scores for Extra Large Colleges – Full-time and Part-time Participants

21
SCCC Mean Item Scores Below the Mean Scores for Extra Large Colleges – Full-time and Part-time Participants

22
SCCC Mean Item Scores Below the Mean Scores for Extra Large Colleges – Full-time and Part-time Participants (Cont’d)
")
23
Mean Item Score Comparisons Comparison with SUNY Consortium

24
SCCC Mean Item Scores Above/Below the Mean Scored for SUNY Consortium – All Participants

25
SCCC Mean Item Scores Above the Mean Scores for SUNY Consortium – Full-Time and Part-time Participants

26
SCCC Mean Item Scores Below the Mean Scores for SUNY Consortium – Full-time and Part-time Participants

27
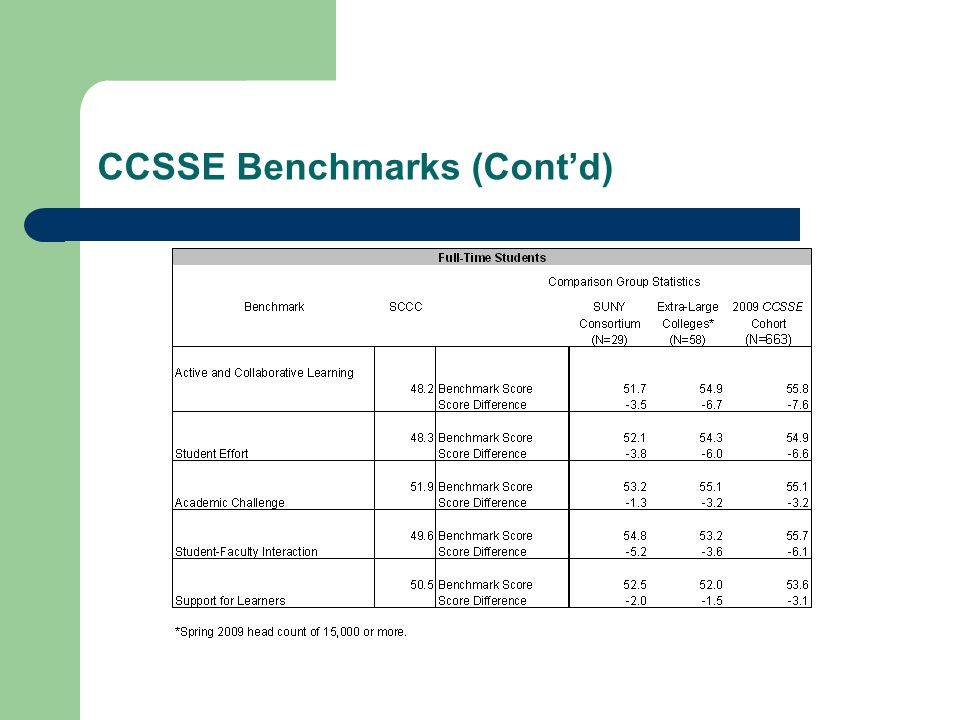
CCSSE Benchmarks Five composite indices composed of conceptually related items on the CCSSE instrument Encompass 38 engagement items that reflect many of the most important aspects of the student experience The benchmarks are: Active and Collaborative Learning Student Effort Academic Challenge Student-Faculty Interaction Support for Learners

28
CCSSE Benchmarks (Cont’d) Active and Collaborative Learning Composed of 7 items Sample Items: During the current school year, how often have you asked questions in class or contributed to class discussions? During the current school year, how often have you made a class presentation?

29
CCSSE Benchmarks (Cont’d) Student Effort Composed of 8 items Sample Items: During the current school year, how often have you prepared two or more drafts of a paper or assignment before turning it in? During the current school year, how often have you used peer or other tutoring?

30
CCSSE Benchmarks (Cont’d) Academic Challenge Composed of 10 items Sample Items: During the current school year, how often have you worked harder than you thought you could to meet an instructor’s standards or expectations? How much does your coursework at this college emphasize synthesizing and organizing ideas, information, or experiences in new ways?

31
CCSSE Benchmarks (Cont’d) Student-Faculty Interaction Composed of 6 items Sample Items: During the current school year, how often have you used email to communicate with an instructor? During the current school year, how often have you talked about career plans with an instructor or advisor?

32
CCSSE Benchmarks (Cont’d) Support for Learners Composed of 7 items Sample Items: How much does this college emphasize providing the support you need to help you succeed at his college? How much does this college emphasize providing the financial support you need to afford your education?

33
CCSSE Benchmarks (Cont’d)
")
37
Conclusions: Areas that Need Addressing Academic & Student Services in the following areas: – Academic Advising/Planning – Tutoring – Financial Aid Advising – Computing Labs

38
Conclusions: Areas that Need Addressing (Cont’d) Faculty-Student Interaction Active and Collaborative Learning Student Effort Part-time Students
 Faculty-Student Interaction Active and Collaborative Learning Student Effort Part-time Students")
39
Next Steps Additional Research – Student Focus Groups – Best Practices Action – Faculty & Staff Forums to Discuss Results (Predicted vs. Actual Responses) – Work Teams to Focus on Key Areas
 – Work Teams to Focus on Key Areas.")
40
Results of the Spring 2009 CCSSE Administration Questions?

Similar presentations


 Community College Faculty Survey of Student Engagement 2005 Findings Presenter: LaSylvia Pugh – September 14, 2006.>")


 Community College Survey of Student Engagement 2005 Findings Presenter: LaSylvia Pugh – August 29, 2006.>")
