Download presentation
Presentation is loading. Please wait.

1
Statistics as a Tool A set of tools for collecting, organizing, presenting and analyzing numerical facts or observations.

6
Similar Concepts Across Cultures

12
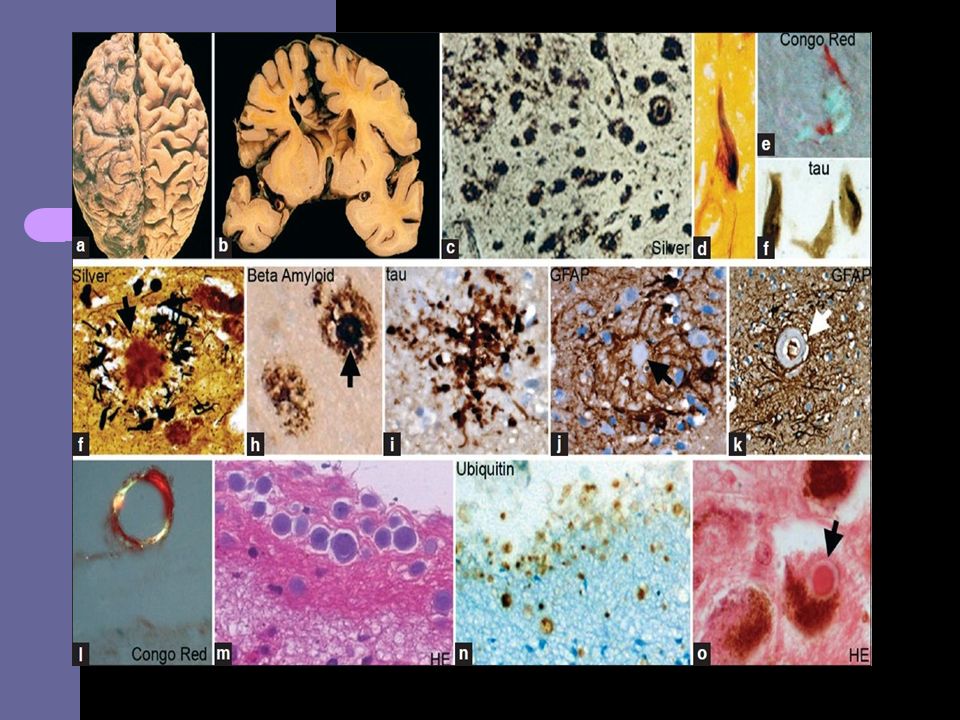
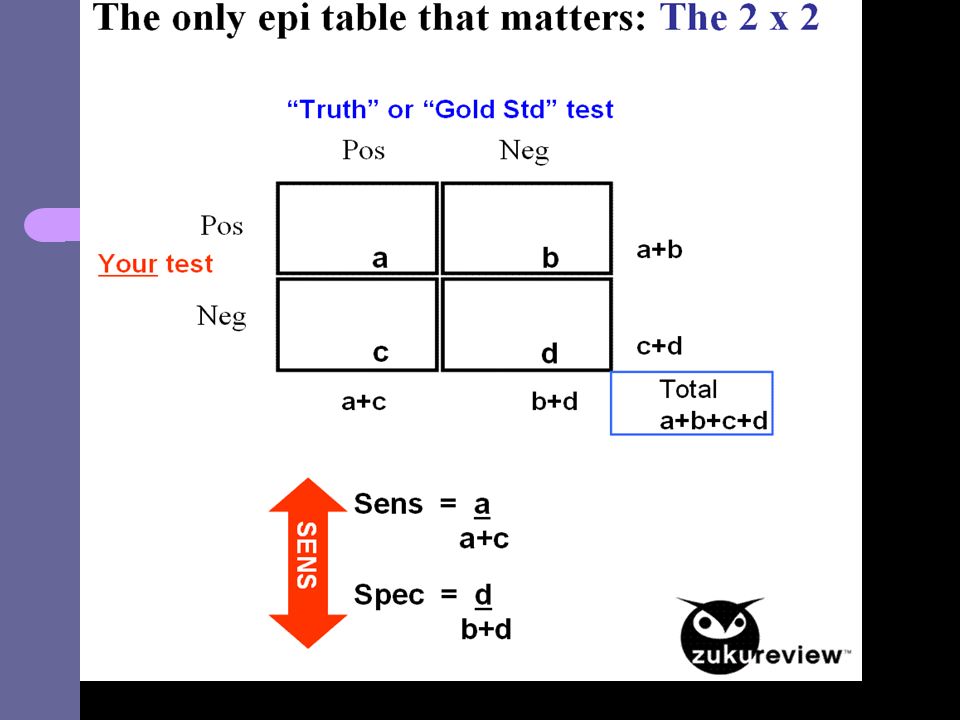
Http://www.uptodate.com

14
Descriptive Statistics Numerical facts or observations that are organized describe the frequencies, measures of central tendency, and degree of dispersion of variables in a sample of a larger population.

15
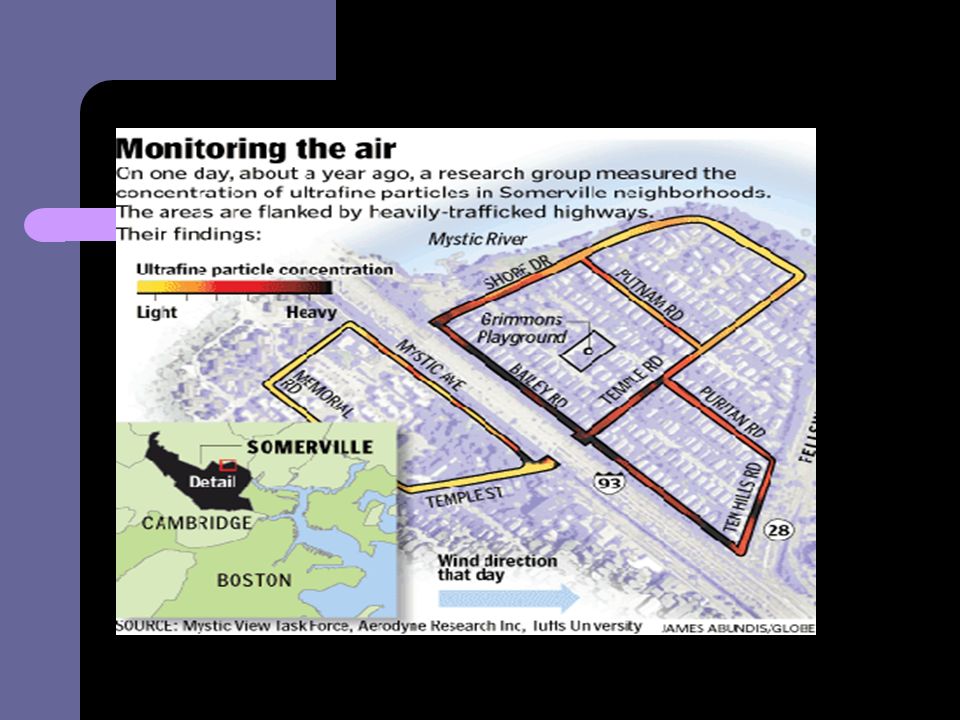
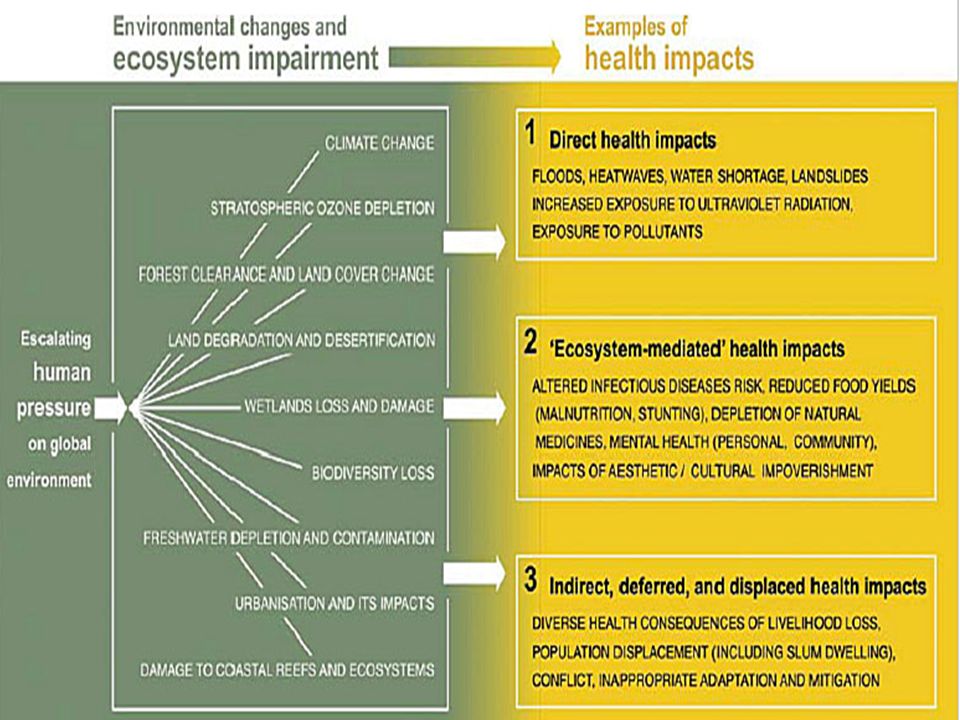
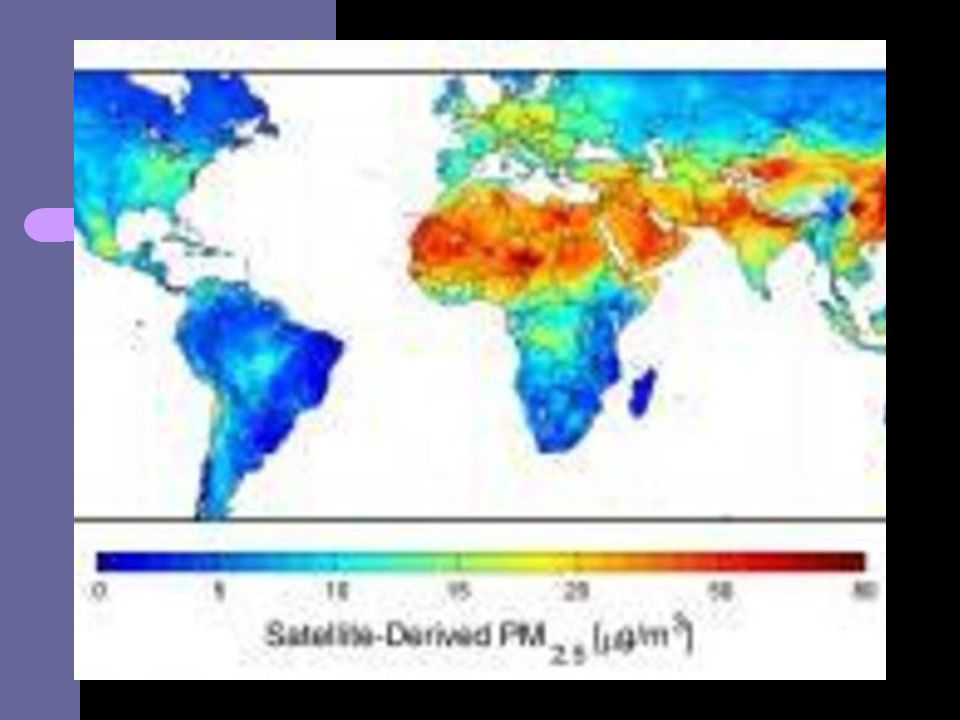
Environmental Studies: Air/Water

17
Levels of Measurement Reflects type of information measured and helps determine what descriptive statistics and which statistical test can be used.

18
Four Levels of Measurement NOIR -- no one is ready Nominal – lowest level, categories, no rank Ordinal – second lowest, ranked categories Interval – next to highest, ranked categories with known units between rankings Ratio – highest level, ranked categories with known intervals and an absolute zero

19
Descriptives for nominal and ordinal data Frequencies and percentages Frequencies – absolute number of cases Percentages – relative number of cases

20
Descriptives for interval/ratio (scale) variables Measures of central tendency – Mean -- sum of all cases divided by number of cases – Median – case for which half of all other cases are above and half of all other cases are below. – Mode – most frequently occurring case

21
Descriptives for scale variables Measures of dispersion – Range – Value of cases from minimum to maximum – Standard Deviation – number which when added or taken away from each case adds up to zero. – Variance – Standard deviation squared

22
Inferential statistics Procedures used to make inferences from sample data and generalize findings to the population

23
Probability Statistical significance – the probability that the difference or the association found in the sample would be present in the population. Three common probabilities used <.05 <.01 <.001

24
Sampling bias The systematic differences between sample in study and the larger population of interest. The use of inferential statistics allows us to calculate the odds that what is found in the sample is due to sampling bias.

25
Statistical significance (p-levels) When p <.05, the degree of difference or association being tested would only occur by chance alone five times out of a hundred. When p <.01, the difference or association being observed would only occur by chance alone one time out of a hundred. When p <.001……

26
Testing for statistically significant differences When you want to see if there is a difference in outcome by group membership, or by treatment approach. SPSS – Analyze Compare means – Independent t-test

28
Planned Parenthood

31
Earth is in need of another one/third earth addition: 8 billion

32
Is there a significant difference in months of service and type of outcome?

33
The Need for Pure Water

34
What cvan be done? Ans: wells/solar heat

36
Emerging

39
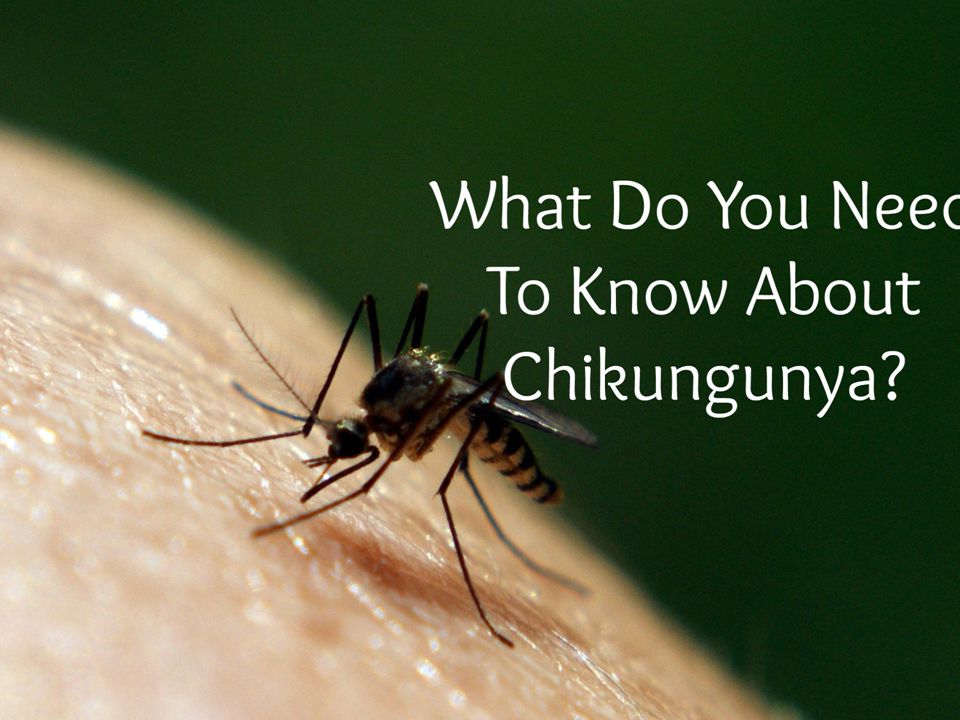
Common Vectors 39 Mosquitoes serve as vectors for Malaria, Dengue fever, Yellow fever, and Chikungunya Ticks can serve as vectors for Lyme disease, Rickettsia, and Babesiosis

42
Statistically significant differences i.v. nominal and d.v. interval/ratio Analyze – Univariate (One d.v.; multiple predictors) – Multivariate (Multiple d.v.; multiple predictors) – Repeated measures (time series of dependent measures; one predictor.
 – Multivariate (Multiple d.v.; multiple predictors) – Repeated measures (time series of dependent measures; one predictor..")
44
Statistically significant associations at higher levels of measurement Analyze – Correlate Bi-variate – Pearson’s (two interval/ratio variables) – Kendall’s tau (two ordinal variables) – Spearman’s rho (two ordinal variables)
 – Kendall’s tau (two ordinal variables) – Spearman’s rho (two ordinal variables)")
45
Test of Pearson Correlation Coefficient (r)
")
46
Person-Doctor==Public Health Group===Population==Mamny

48
Independent t-test to determine statistical significance

49
Differences between groups at lower levels of measurement Analyze – Descriptives… – Crosstabs – Identify variable in row and column – Select statistics Two nominal (dichotomized) Chi-Square Nominal by ordinal Kendal’s tau-b Nominal by intervalEta
 Chi-Square Nominal by ordinal Kendal’s tau-b Nominal by intervalEta")
50
Difference in LOS by referral

51
Crosstabs to determine difference between groups

52
Chi-Square tests

53
Which test to use when? Decision is made by what the question is, the level of measurement of the variable and the extent to which assumptions of parametric statistics are met. Question: Difference or Association? Level of measurement: NOIR? Sample size and distribution (normal?)
.")
54
Tests comparing difference between 2 or more groups TestDependent variable Independent variable Paired (dependent) t-test Interval/ratio pre and post tests Nominal Unpaired (independent t- test Interval/ratioNominal (2 grps) ANOVA F-testInterval/ratioNominal (>2 grps) Chi-Square (Nonparametric) Nominal (Dichotomous) Nominal
 t-test Interval/ratio pre and post tests Nominal Unpaired (independent t- test Interval/ratioNominal (2 grps) ANOVA F-testInterval/ratioNominal (>2 grps) Chi-Square (Nonparametric) Nominal (Dichotomous) Nominal")
55
Tests demonstrating association between two groups TestDependent var.Independent var. Spearman rhoOrdinal Mann-Whitney U Non-parametric OrdinalNominal Pearson’s rInterval/ratio

56
Tests demonstrating association between two groups, controlling for third variable TestDependentIndependent Logistic regression Nominal Linear regressionInterval/ratio Pearson partial rInterval/ratio Kendall’s partial rOrdinal

59
Mission,Manpower,Math,Maintain

60
How do you handle malnutrition?

61
Many healthcare task forces

62
How do you handle AIDS?

63
Different Theories About HIV/AIDS

64
Is Health a Right or is Health a Commodity?

66
USA Health Care Business Barriers

67
Some countries will lose

71
What can be done?

Similar presentations


: Analysing data.>")


