Download presentation
Presentation is loading. Please wait.

1
REVISIONS TO PCE INFLATION MEASURES: IMPLICATIONS FOR MONETARY POLICY Dean Croushore University of Richmond Visiting Scholar, Federal Reserve Bank of Philadelphia October 2007

2
Motivation In 2000, Fed switched main variable for inflation to PCE price index (PCE inflation); in 2004 switched to PCE price index excluding food and energy prices (core PCE inflation) Problem: these variables get revised Issue: are the revisions large enough to worry about?
; in 2004 switched to PCE price index excluding food and energy prices (core PCE inflation) Problem: these variables get revised Issue: are the revisions large enough to worry about")
3
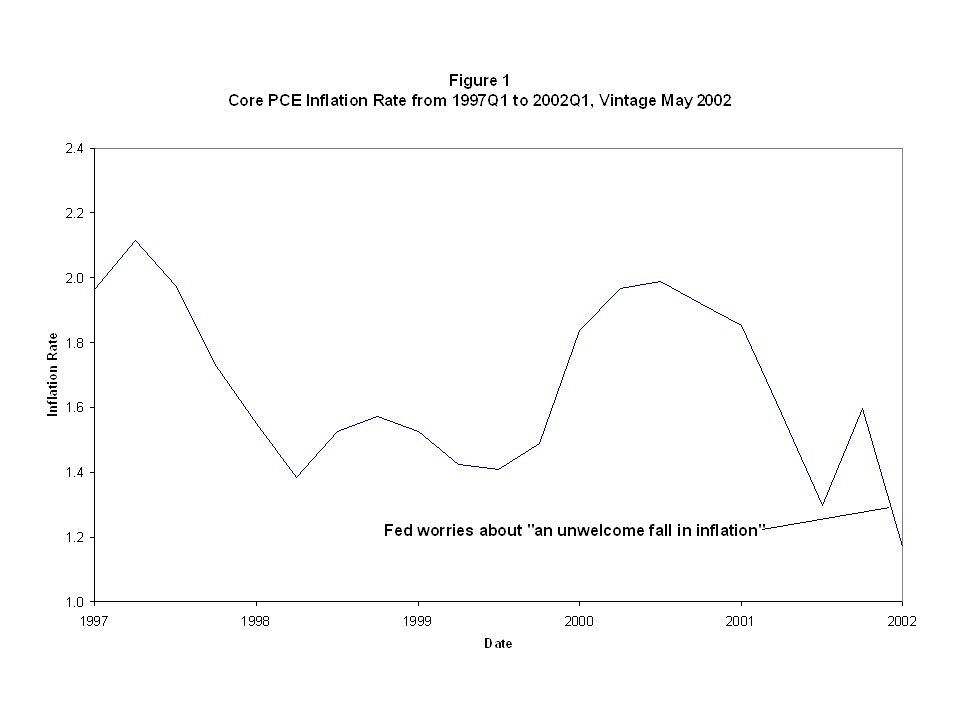
Motivating example May 2002: FOMC adds line in statement issued after meeting that it fears “an unwelcome decline in inflation”; data show decline in core PCE inflation from 2.0% in 2000Q3 to 1.2% in 2002Q1 Academic research on deflation and the zero bound are fresh in policymakers’ minds

5
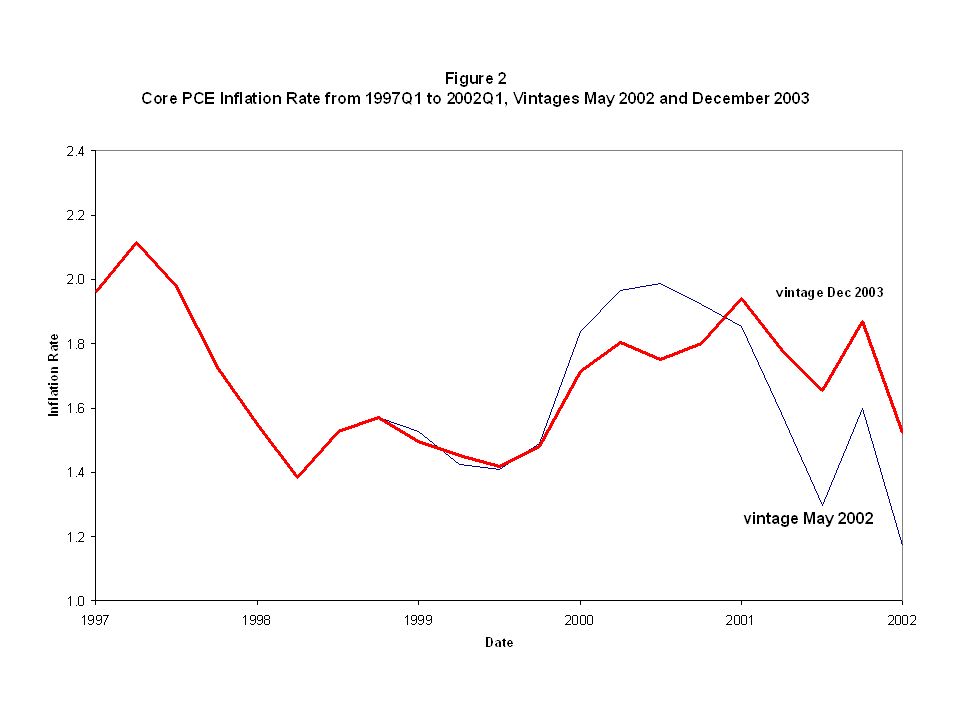
Motivating example Perhaps as a consequence of worry about low inflation, Fed drives real fed funds rate to negative levels for first time since early 1970s But: revised data by December 2003 show that inflation wasn’t declining after all v=May2002 v=Dec2003 2000Q3 2.0% 1.7% 2002Q1 1.2% 1.5%

7
Motivating example The Fed gets rid of the “unwelcome fall” language by May 2004. Revised data by August 2005 show Fed should have worried about an unwelcome rise in inflation 2000Q3 2002Q1 v=May 2002 2.0% 1.2% v=Dec2003 1.7% 1.5% V=Aug2005 1.6% 1.8%

9
Motivation Policymakers need to understand revisions to inflation This paper: –Determine characteristics of revisions –Investigate forecastability of revisions

10
Data Croushore-Stark real-time data set –Nominal PCE and Real PCE used to create series on PCE price index (PPCE) Vintages from 1965Q4 to 2007Q3 –New real-time series collected on PCE price index excluding food and energy prices (PPCEX) Vintages from 1996Q1 to 2007Q3 Note that history is limited, as first vintage appeared in 1996Q1
 Vintages from 1965Q4 to 2007Q3 –New real-time series collected on PCE price index excluding food and energy prices (PPCEX) Vintages from 1996Q1 to 2007Q3 Note that history is limited, as first vintage appeared in 1996Q1")
11
Data Two inflation concepts –One-quarter inflation –Four-quarter inflation –v = vintage, t = date to which data refer, t < v

12
Data Concepts of releases –Initial release: first value of inflation reported at v = t + 1; denoted i –August release: value of inflation reported in August (usually) of following year; incorporate income-tax return data; denoted A
 of following year; incorporate income-tax return data; denoted A")
13
Data Concepts of releases –Pre-benchmark release: last value of inflation reported before a benchmark revision; occur about every five years; allow us to abstract from redefinitions; denoted b –Latest available data: the last vintage in the data set; August 2007 in this paper; denoted i

14
Data Concepts of revisions –For both PCE inflation and core PCE inflation, for both 1-quarter inflation and 4-quarter inflation: i_A: from initial release to August release i_b: from initial release to pre-benchmark i_l: from initial release to latest data A_b: from August release to pre-benchmark A_l: from August release to latest data b_l: from pre-benchmark to latest data

15
Revisions Various revision concepts show different patterns over time Look at revision from initial to latest for core PCE inflation over 4 quarters: large revisions relative to inflation rate in several years

17
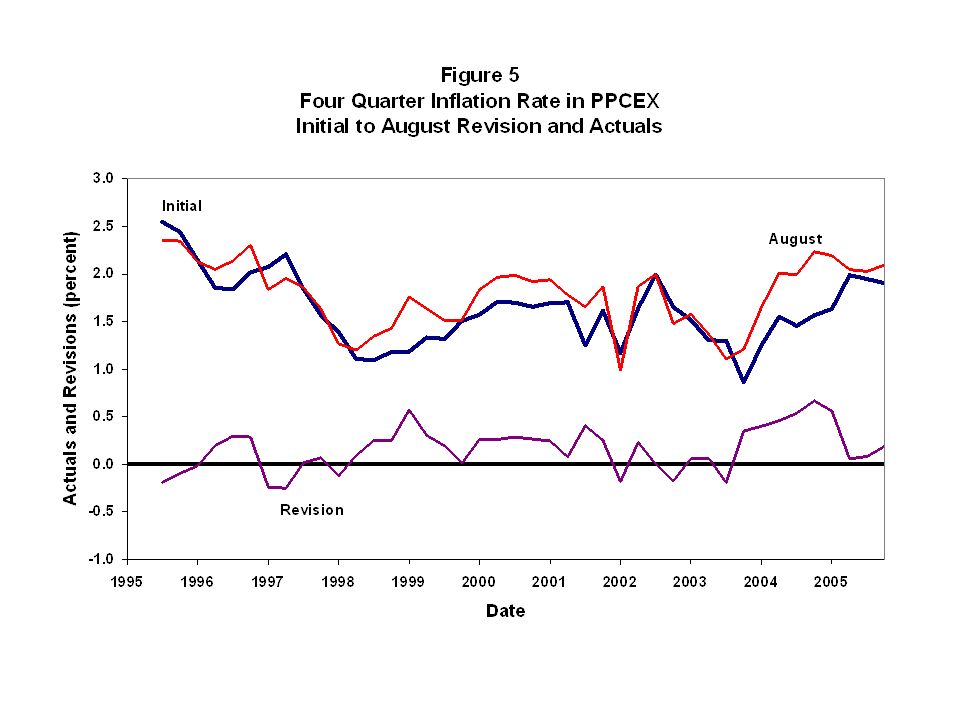
Revisions Look at revision from initial to August for core PCE inflation over 4 quarters Revisions appear to be positive in most years; averaging about +0.3.

19
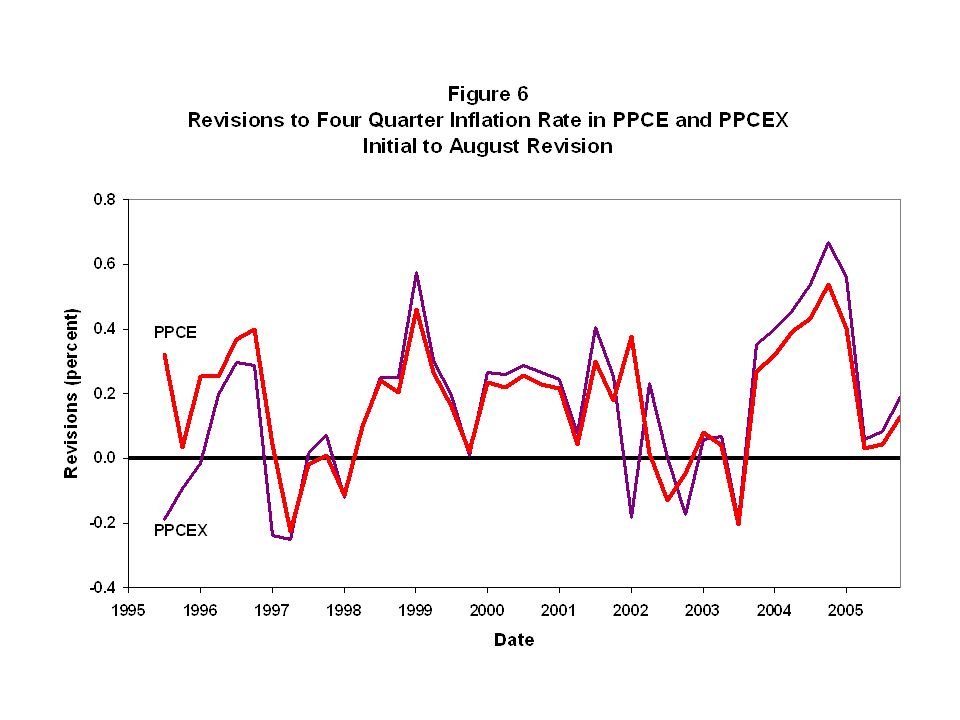
Revisions Revisions to PCE inflation and core PCE inflation are similar We have longer sample for PCE inflation (1965Q3 to 2006Q4) than core PCE inflation (1996Q1 to 2006Q4), so use the former for more comprehensive view of revisions
 than core PCE inflation (1996Q1 to 2006Q4), so use the former for more comprehensive view of revisions")
21
Characteristics of Revisions First, get a feel for the size of revisions to different concepts (Table 1)
")
22
Table 1 Statistics on Revisions One-Quarter Inflation Rate PPCEX PPCE standard 90% standard 90% Revisionerror intervalerror interval i_A0.41−0.48, 0.790.65−1.02, 1.08 i_b0.39−0.48, 0.640.54−0.79, 1.08 i_l0.46−0.59, 0.910.89−1.37, 1.48 A_b0.33−0.58, 0.380.53−0.98, 0.70 A_l0.40−0.71, 0.690.84−1.31, 1.36 b_l0.31−0.39, 0.510.85−1.36, 1.41

23
Table 1 (cont.) Statistics on Revisions Four-Quarter Inflation Rate PPCEX PPCE standard 90% standard 90% Revisionerror intervalerror interval i_A0.23−0.19, 0.560.32−0.38, 0.57 i_b0.26−0.25, 0.580.26−0.34, 0.56 i_l0.32−0.38, 0.650.44−0.59, 0.95 A_b0.21−0.50, 0.170.29−0.47, 0.36 A_l0.24−0.38, 0.300.43−0.73, 0.83 b_l0.16−0.28, 0.300.44−0.91, 0.71
 Statistics on Revisions Four-Quarter Inflation Rate PPCEX PPCE standard 90% standard 90% Revisionerror intervalerror interval i_A0.23−0.19, −0.38, 0.57 i_b0.26−0.25, −0.34, 0.56 i_l0.32−0.38, −0.59, 0.95 A_b0.21−0.50, −0.47, 0.36 A_l0.24−0.38, −0.73, 0.83 b_l0.16−0.28, −0.91, 0.71")
24
Characteristics of Revisions Size of revisions (Table 1) Generally, revisions over longer spans have potential to be revised more, so standard error rises, 90% interval rises in size Exception is revision from August release to pre-benchmark release; probably because of some August releases coming after benchmark revisions
 Generally, revisions over longer spans have potential to be revised more, so standard error rises, 90% interval rises in size Exception is revision from August release to pre-benchmark release; probably because of some August releases coming after benchmark revisions")
25
Test for Zero Mean Revisions Simple test: is the mean revision zero? Results in Table 2

26
Table 2 Zero-Mean Test PPCEX PPCE Revisionp-valuep-value i_l 0.090.20 0.110.12 i_b 0.050.42 0.060.20 i_A 0.140.03* 0.100.06 A_b−0.090.08−0.040.31 A_l−0.050.42 0.010.85 b_l 0.040.37 0.060.41

27
Test for Zero Mean Revisions Simple test: is the mean revision zero? Results in Table 2 Revisions after initial release tend to be positive, but in only one case do we reject the null hypothesis that the mean differs from zero

28
Test for Zero Median Revisions Simple test: are positive and negative revisions equally likely? Sign test (Table 3)
.")
29
Table 3 Sign Test PPCEX PPCE Revision sp-value sp-value i_l 0.600.22 0.570.07 i_b 0.520.76 0.520.62 i_A 0.670.03* 0.570.07 A_b 0.450.54 0.370.00* A_l 0.430.35 0.470.41 b_l 0.430.35 0.540.33

30
Test for Zero Median Revisions Simple test: are positive and negative revisions equally likely? Sign test (Table 3) Results: two cases that reject null hypothesis that proportion of positive revisions is one-half –Core PCE inflation: initial to August –PCE inflation: August to pre-benchmark
 Results: two cases that reject null hypothesis that proportion of positive revisions is one-half –Core PCE inflation: initial to August –PCE inflation: August to pre-benchmark.")
31
News versus Noise Revisions that incorporate news increase the standard deviation of later releases; revisions correlated with later releases; consistent with early releases being optimal forecasts of later releases Revisions that reduce noise reduce the standard deviation of later releases; revisions correlated with earlier releases; consistent with early releases being inefficient forecast of later releases

32
News versus Noise News-noise test 1: –If standard deviation of releases rise for later release concepts → news –If standard deviation falls → noise –Results in Table 6

33
Table 6 Standard Deviations of Inflation Rates Data Set PPCEXPPCE Initial Release0.5822.757 August0.5782.680 Pre-Benchmark0.5362.817 Latest0.4782.697

34
News versus Noise News-noise test 1: –If standard deviation of releases rise for later release concepts → news True for PPCE for August to pre-benchmark revision –If standard deviation falls → noise True for all revisions of PPCEX True for PPCE for initial to August revision, pre- benchmark to final revision

35
News versus Noise News-noise test 2: look at correlation between revisions and earlier or later releases –Revision correlated with later release: news –Revision correlated with earlier release: noise Results in Table 7

36
News versus Noise Table 7 results PPCEX –10 noise revision tests: 9 are significant Implies that all revisions reduce noise –4 news revision tests: 0 are significant Implies that no revisions provide news

37
News versus Noise Table 7 results PPCE (much longer sample) –10 noise revision tests: 7 are significant Implies that some revisions reduce noise –4 news revision tests: 1 is significant Implies that August to pre-benchmark revision provides news –Most likely candidates for forecasting revisions: initial to August and pre-benchmark to latest
 –10 noise revision tests: 7 are significant Implies that some revisions reduce noise –4 news revision tests: 1 is significant Implies that August to pre-benchmark revision provides news –Most likely candidates for forecasting revisions: initial to August and pre-benchmark to latest")
38
Forecasting Revisions Given these full sample results, can we forecast revisions in real time out of sample? First, try forecasting August release given initial release –Roll through sample starting in 1985Q1 –Run regression of revision on actual: r(i, A, 1, t) = α + β i(1, t) + ε(t). (1)
 = α + β i(1, t) + ε(t). (1).")
39
Forecasting Revisions Forecasting August release given initial release –Use regression coefficients to estimate revision, then apply to initial release: –Calculate RMSE of this forecast of the actual, compare with RMSE assuming that initial release is optimal forecast of August release

40
Table 8 RMSEs for Forecast-Improvement Exercises Panel A: Actuals = August Release RMSE Forecast based on initial release, eq. (2)0.452 Assume no revision from initial0.490 Forecast Improvement Exercise Ratio 0.922
0.452 Assume no revision from initial0.490 Forecast Improvement Exercise Ratio")
41
Forecasting Revisions Forecasting revisions from initial to August release appears promising, reduces RMSE in this sample

42
Forecasting Revisions Try same thing for revision from pre- benchmark to latest data Big problem in implementing in real time: when new benchmark revision occurs, run regression based on latest available data, but latest available data will change over time So procedure seems less likely to forecast revisions well

43
Forecasting Revisions Forecasting revision from pre-benchmark to latest data Typical regression: r(b, v1985Q4, 1, t) = α + β i(1, t) + ε(t). (3) Forecast of latest data: Results in Table 8B
 Forecast of latest data: Results in Table 8B.")
44
Table 8 (cont.) RMSEs for Forecast-Improvement Exercises RMSE Panel B: Actuals = Latest Available Release Forecast based on pre-benchmark release, eq. (4)0.940 Assume no revision from pre-benchmark0.681 Forecast Improvement Exercise Ratio 1.380
0.940 Assume no revision from pre-benchmark0.681 Forecast Improvement Exercise Ratio")
45
Forecasting Revisions Forecasting revision from pre-benchmark to latest data Results show revisions not forecasted well; better to use pre-benchmark values as optimal forecast of latest-available data

46
Forecasting Revisions What if you want to forecast the revision from pre-benchmark to latest data just before a new benchmark revision comes out? Example: Just before December 2003 benchmark revision: can we predict the revised values for data from 1985Q1 to 2003Q3?

47
Table 8 (cont.) RMSEs for Forecast-Improvement Exercises RMSE Panel C: Actuals = vintage 2004:Q1 Forecast based on pre-benchmark release, eq. (4)0.713 Assume no revision from pre-benchmark0.686 Forecast Improvement Exercise Ratio 1.039
0.713 Assume no revision from pre-benchmark0.686 Forecast Improvement Exercise Ratio")
48
Forecasting Revisions Results (Table 8C) not as bad as 8B, but better off assuming no revision Overall: Revision from initial release to August appears forecastable; nothing else does
 not as bad as 8B, but better off assuming no revision Overall: Revision from initial release to August appears forecastable; nothing else does")
49
Forecasting Revisions 2007 data: my forecasts of revisions PCE Inflation Initial Forecast Release Aug2008 Date 2007:Q13.35%3.50% 2007:Q24.31%4.40%

50
CONCLUSIONS AND IMPLICATIONS FOR POLICYMAKERS PCE inflation rates may be revised significantly Policymakers may wish to down-weight their response to inflation data because of uncertainty Analysts can easily forecast revisions to PCE inflation

Similar presentations


 October 2009 *The views and opinions.>")
