Download presentation
Presentation is loading. Please wait.

1
Determine a method to simulate each of the following events: If 15% of all AP statistics students get a “5” on the AP exam, how many would we need to randomly select until we selected someone who got a “5”? A professional basketball player has a 73% free throw percentage, and needs to make their next two free throw attempts. Warm up! Put these on a separate sheet of paper. I might RANDOMLY decide to collect!

2
Homework questions

3
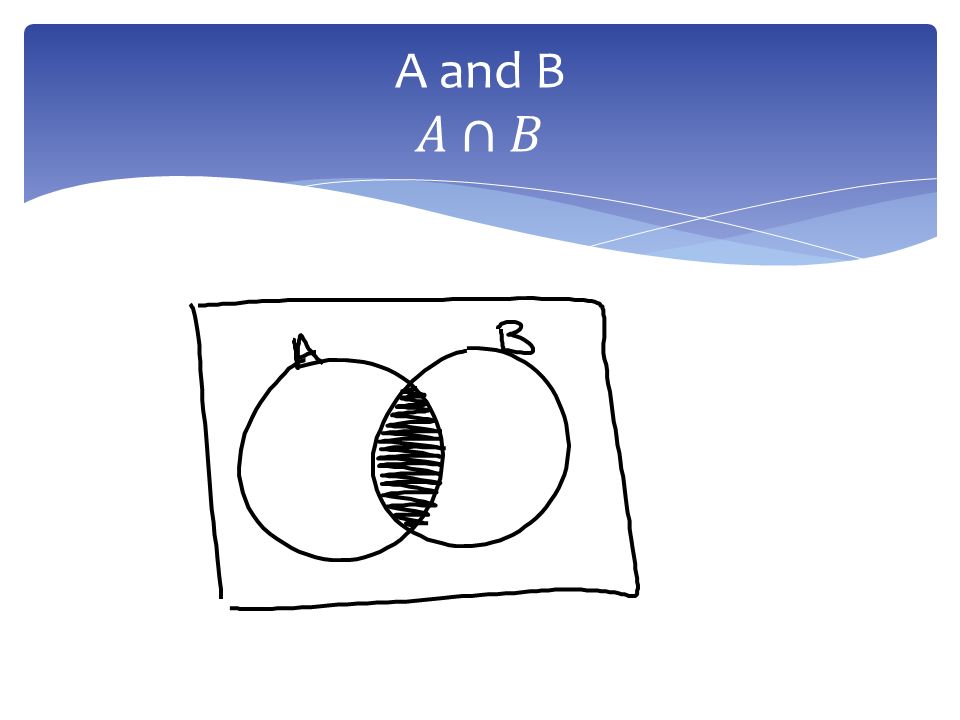
5.2 Venn Diagrams

4
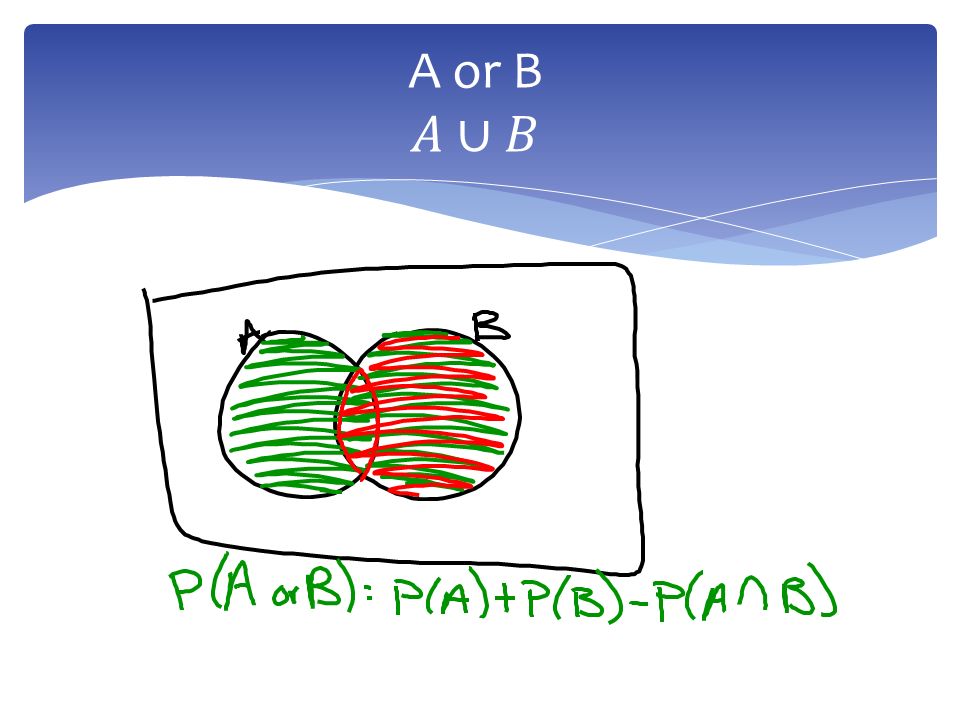
When we find P(A or B) we were having to add up individual cells from our tables. When we say we are going to the football game or watching a movie that usually means we will do one or the other, BUT NOT BOTH! In statistics, “A or B” could mean one or the other or both… When we did those problems in yesterday’s notes we added each cell and divided by the total to get P(A or B) Issue from yesterday…
 Issue from yesterday….")
5
Find P(male or pierced ears) Another way to look at it GenderYesNoTotal Male197190 Female84488 Total10375178
 Another way to look at it GenderYesNoTotal Male Female84488 Total")
6
P(A) = 90/178 P(B) = 103/178 P(A and B) = 19/178 The middle is double counted if we simply add P(A or B) = P(A) + P(B) – P(A and B) Venn Diagrams
 = 90/178 P(B) = 103/178 P(A and B) = 19/178 The middle is double counted if we simply add P(A or B) = P(A) + P(B) – P(A and B) Venn Diagrams")
7
P(A or B) = P(A) + P(B) – P(A and B) If the events happen to be mutually exclusive… General Addition Rule for Two Events
 = P(A) + P(B) – P(A and B) If the events happen to be mutually exclusive… General Addition Rule for Two Events")
8
Compliment

9
Mutually Exclusive or Disjoint

12
In an apartment complex, 40% of residents read USA Today. Only 25% read the New York Times. Five percent of residents read both papers. Suppose we select a resident of the apartment complex at random and record which of the following two papers the person reads. Made a two-way table (assume 100 people total to make easy) Construct a Venn Diagram Find the probability that the person reads at least one of the two papers. Find the probability that the person doesn’t read either paper. Example
 Construct a Venn Diagram Find the probability that the person reads at least one of the two papers. Find the probability that the person doesn’t read either paper. Example.")
13
Reads New York Times YesNoTotal Yes52025 No354075 Total4060100 Two-Way Table

14
Venn Diagram

15
Answer Questions

16
Section 5.2 homework: Pg. 309 (39- 46, 49-56) Homework
 Homework")
Similar presentations


 = P(in a single trial,>")


 GENERAL PROBABILITY RULES.>")

