Download presentation
Presentation is loading. Please wait.

1
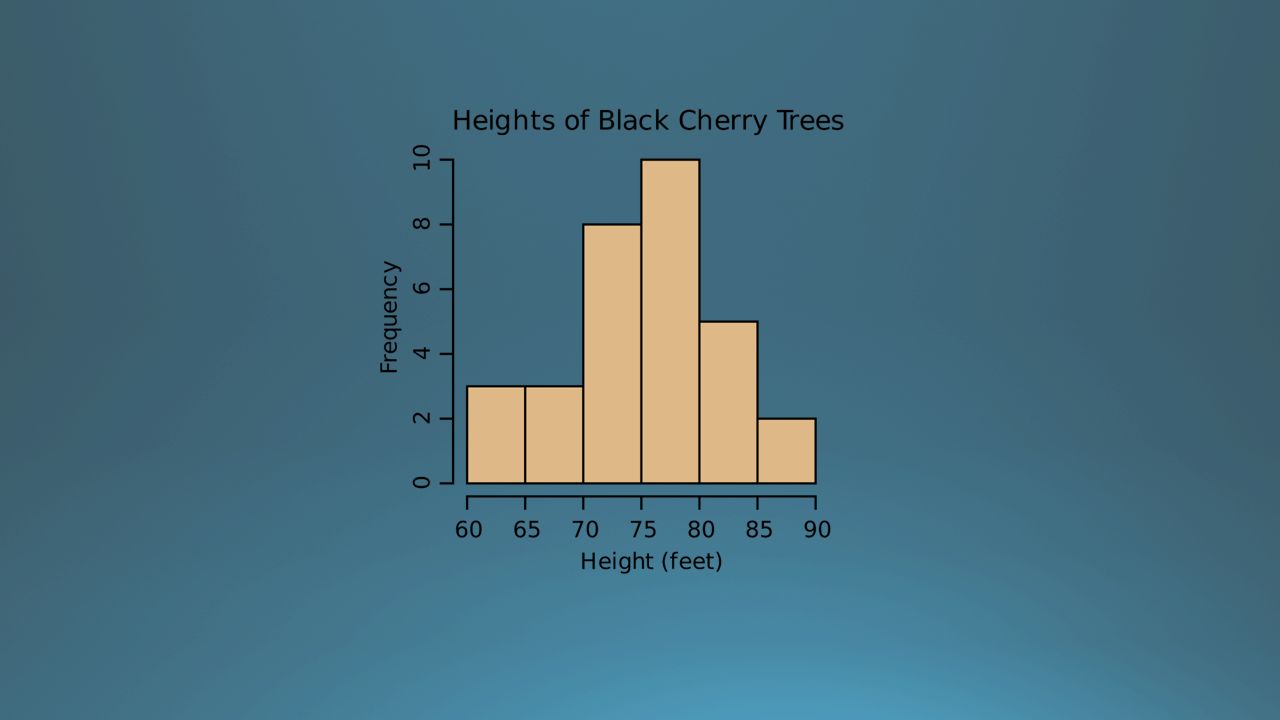
a graph that shows the distribution of a variable used to “summarize” data visually on a graph

2
a single continuous variable broken into different intervals ~8-20 intervals

3
the number of individuals in that interval “amount”, “frequency” or “percentage”

7
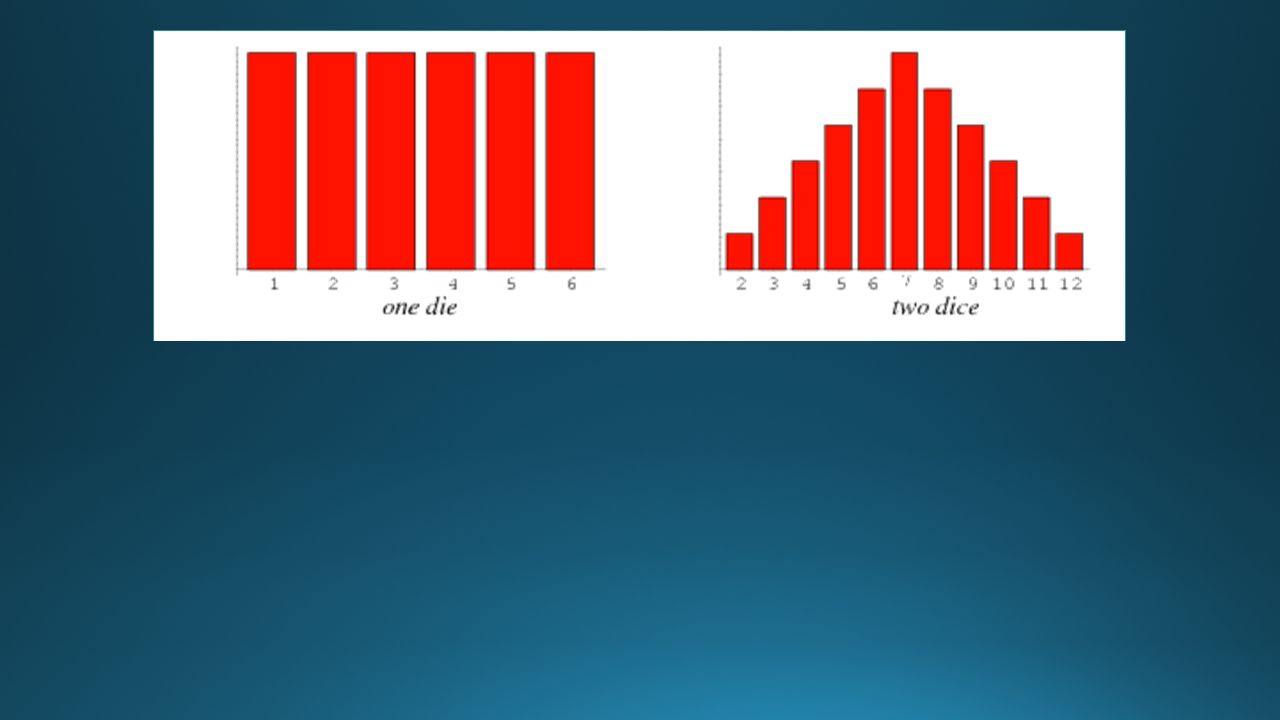
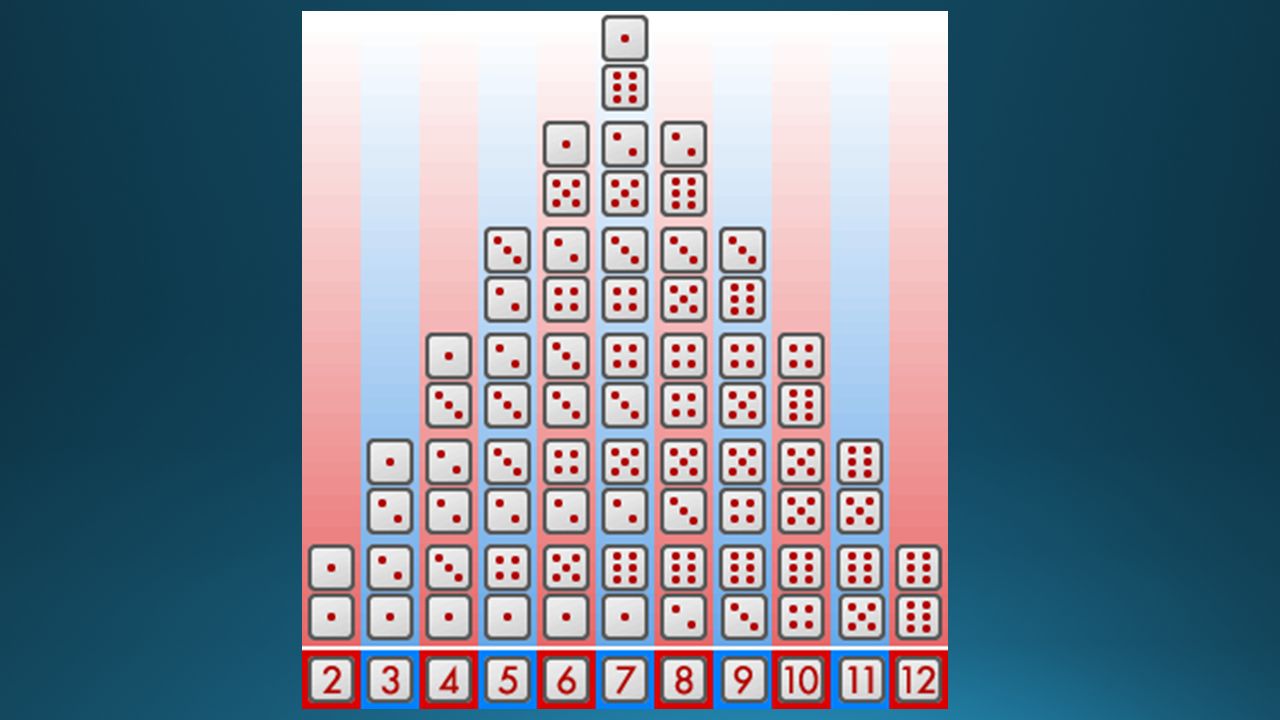
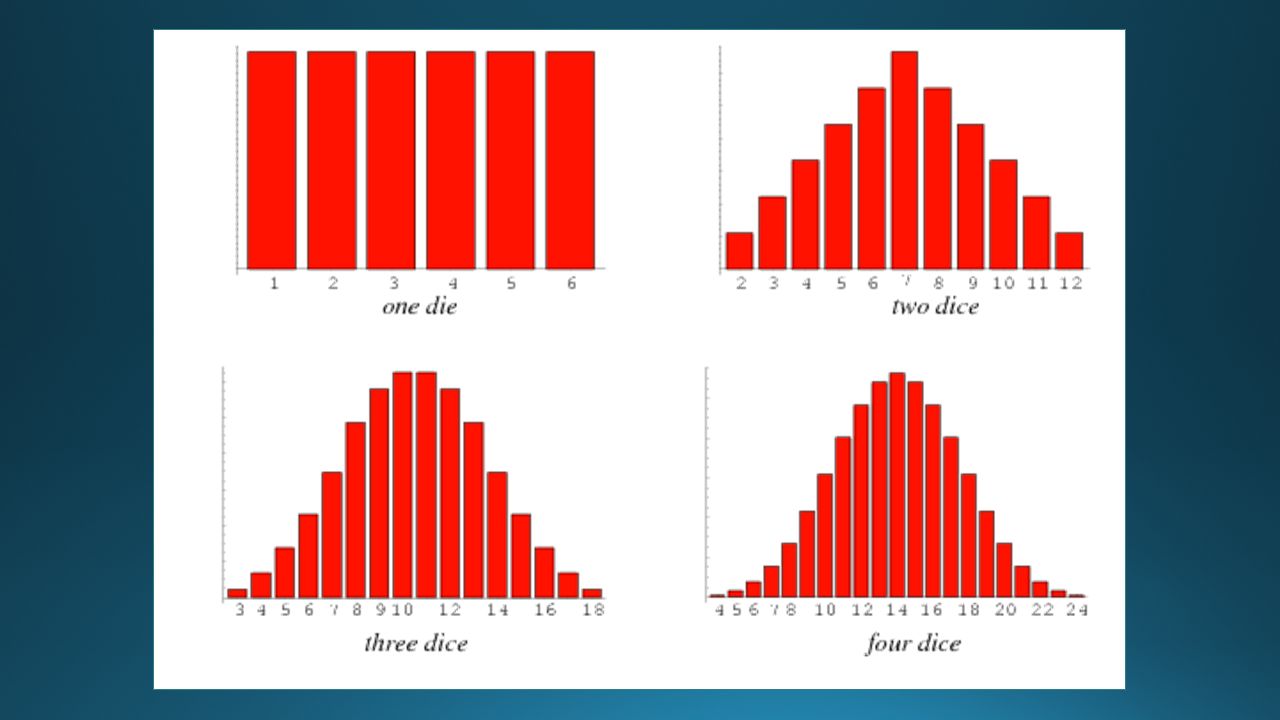
Die Roll 1 2 3 4 5 6

12
Height (cm) 130 140 150 160 170 180 190 200
")
13
Height (cm) 130 140 150 160 170 180 190 200
")
14
Height (cm) 130 140 150 160 170 180 190 200 Distribution Curve: a line drawn over the bars of a histogram to summarize patterns
 Distribution Curve: a line drawn over the bars of a histogram to summarize patterns")
15
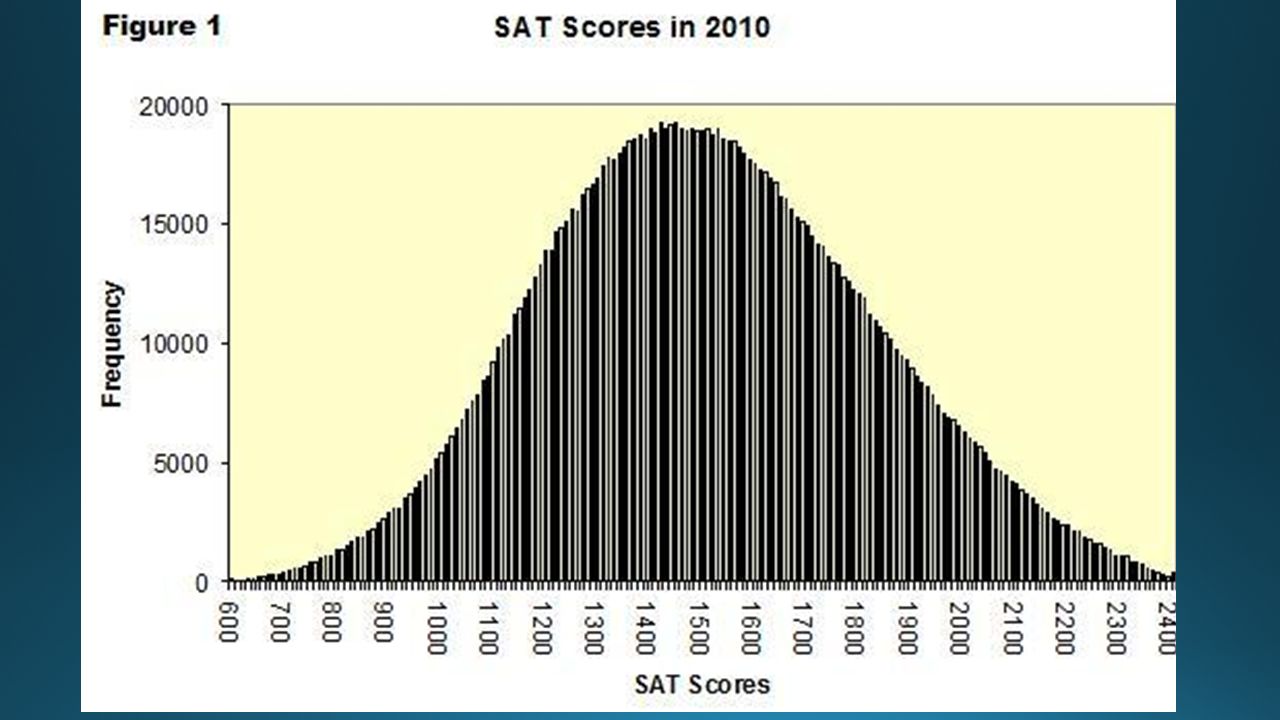
Height (cm) 130 140 150 160 170 180 190 200 Normal Distribution: a distribution that is symmetrical around the mean
 Normal Distribution: a distribution that is symmetrical around the mean")
16
Height (cm) 130 140 150 160 170 180 190 200 Standard Deviation = 5 inches Standard Deviation = 2 inches
 Standard Deviation = 5 inches Standard Deviation = 2 inches")
17
Height (inches) 130 140 150 160 170 180 190 200 Standard Deviation: a measure of variance High Standard Deviation = High Variation Low Standard Deviation = Low Variation
 Standard Deviation: a measure of variance High Standard Deviation = High Variation Low Standard Deviation = Low Variation")
18
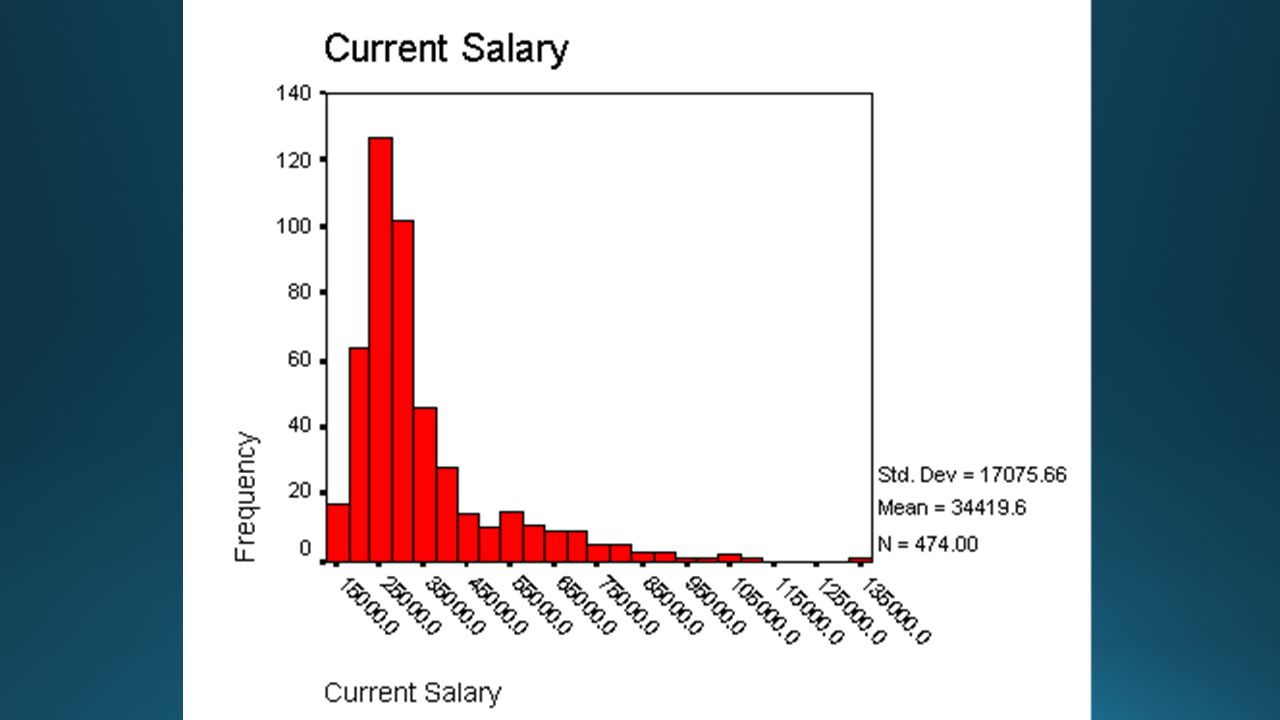
RIGHT SKEWEDLEFT SKEWED

21
MEAN MEDIAN MODE

22
In a normal distribution, MEAN, MEDIAN, and MODE are centered in the middle

23
MEDIANMODE

24
MEAN MEDIANMODE

25
MEAN MEDIANMODE

26
In a skewed distribution, the MODE is at the peak the MEDIAN splits the area under the curve in half Area left of the median = Area right of the median the MEAN is in the direction of the skew The MEAN is most influenced by the skew.

32
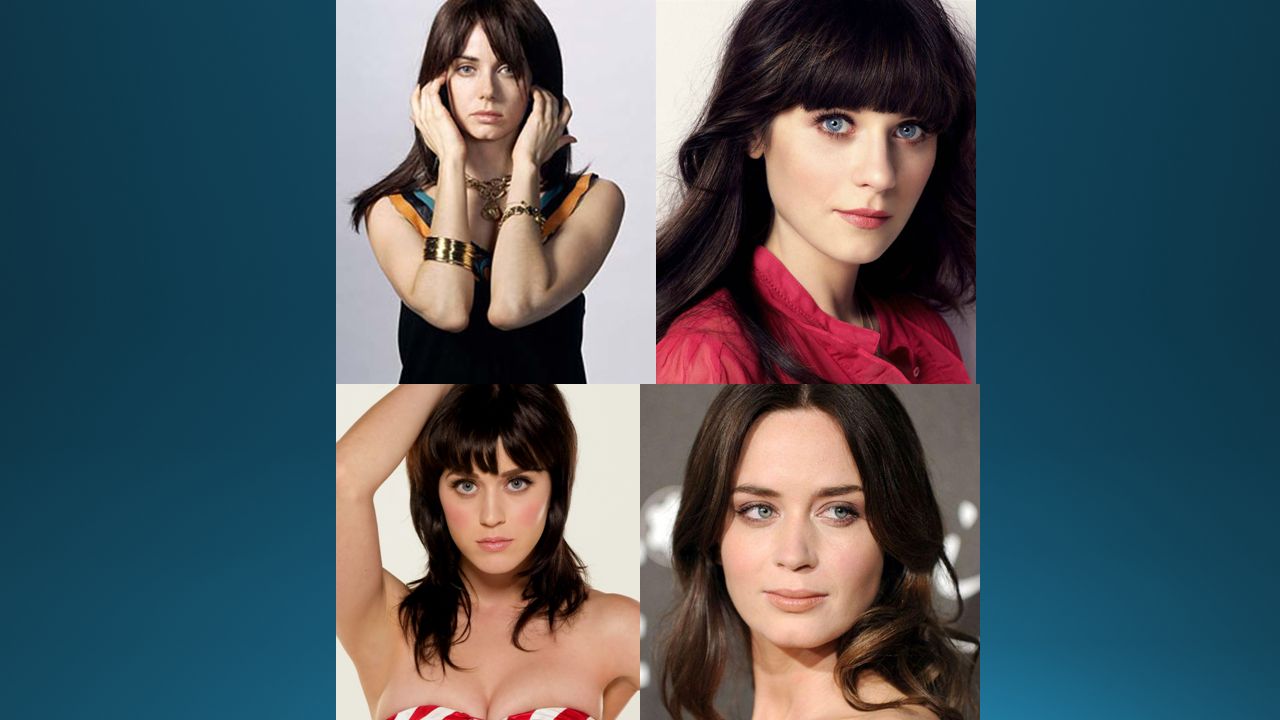
Within a species, there is usually a great deal of variation among individuals.

33
Variation: is a measure of differences

34
INHERITED VARIATION results from the differences in DNA also known as “genetic variation” most inherited variation cannot be changed Examples: blood type, hair color, eye color, mid-digit hair, etc.

35
SOURCES OF GENETIC VARIATION Sexual Reproduction: genes mix when two parents create offspring Mutations: individual genes randomly mutate within an individual

36
ACQUIRED VARIATION results from differences in individual lifestyles does NOT affect your DNA does NOT get passed on to offspring Examples: muscle mass, obesity, hair dye, many skills

37
SOURCES OF ACQUIRED VARIATION the environment

38
North side, upper branches South side, upper branches North side, lower branches South side, lower branches The differences between apples are acquired during the growing season. Difference will not be inherited. Apples collected from different positions on the same tree.

39
Most differences in an individual are the result of inherited and acquired variations.

40
low variance high variance Cheetahs, Manatees Leopards, Cuttlefish Populations prefer to have high variation to increase their chance of survival Having high levels of variation allow more potential for evolution

41
Clause Wedekind 1998 Bern University in Switzerland SWEATY SHIRT EXPERIMENT 49 men wore the same shirt for 2 days 44 women were asked to rank the shirts in order of smell preference the scientists measured the MHC genes (genes related to smell) of each male and each female the results found that women preferred shirt smells from males who had the most different MHC genes from their own Women preferred males whose paired offspring would have the greatest genetic variation
 of each male and each female the results found that women preferred shirt smells from males who had the most different MHC genes from their own Women preferred males whose paired offspring would have the greatest genetic variation")
Similar presentations


FREQUENCY 52-530.5 53-541.5 54-551 55-562 56-576.5 57-5818 58-5934.5 59-6079.5.>")


 are studied in populations (group of individuals of the.>")


