Download presentation
Presentation is loading. Please wait.

1
Market Failures 1

2
Review 1.Define Market Failure. 2.Identify the four market failures we have learned in this unit. 3.Explain why are public goods a market failure. 4.Explain why are externalities a market failure. 5.Explain why are monopolies a market failure. 6.By yourself, draw a positive externality. 7.By yourself, draw a negative externality. 8.Use graph to explain the remedy for positive externalities. 9.Use graph to explain the remedy for negative externalities. 10.Name 10 different super heroes. 2

3
Market Failure #4 Unfair Distribution of Wealth 3 Net Worth over $2.3 billion

4
1.What percent of American’s are living in poverty? 2.Why is income distribution a market failure? 4

5
Income Inequality In 2003, the average American family made $66,863. Everyone is obviously rich. What’s wrong with using the average? Averages reveal absolutely nothing about how income is distributed. How does the government measure distribution of income? SIMULATION (Based on 2003 Information) 5
 5.")
6
THE LORENZ CURVE 6

7
Measuring Income Distribution Review the process: The government divides all income earning families into five equal groups (quintiles) from poorest to richest. Each groups represents 20% of the population. If there was perfect equality then 20% of the families should earn 20% of the income, 40% should earn 40% (and so on). The government compares how far the actual distribution is from perfect distribution then attempts to redistribute money fairly. 7
. The government compares how far the actual distribution is from perfect distribution then attempts to redistribute money fairly. 7.")
8
Measuring Income Distribution Summary: Group #1 (Poorest 20%) Total of $5 (5% of total income) Group #2 Total of $10 (10% of total income) Group #3 Total of $15 (15% of total income) Group #4 Total of $25 (25% of total income) Group #5 (Richest 20%) Total of $45 (45% of total income) 8
 Total of $5 (5% of total income) Group #2 Total of $10 (10% of total income) Group #3 Total of $15 (15% of total income) Group #4 Total of $25 (25% of total income) Group #5 (Richest 20%) Total of $45 (45% of total income) 8")
9
20 40 60 80 100 100 80 60 40 20 0 Percent of Families Percent of Income Perfect Equality The Lorenz Curve 9

10
100 80 60 55 40 30 20 15 5 0 Percent of Families Percent of Income Perfect Equality Lorenz Curve (actual distribution) 10 The Lorenz Curve 20 40 60 80 100
 10 The Lorenz Curve")
11
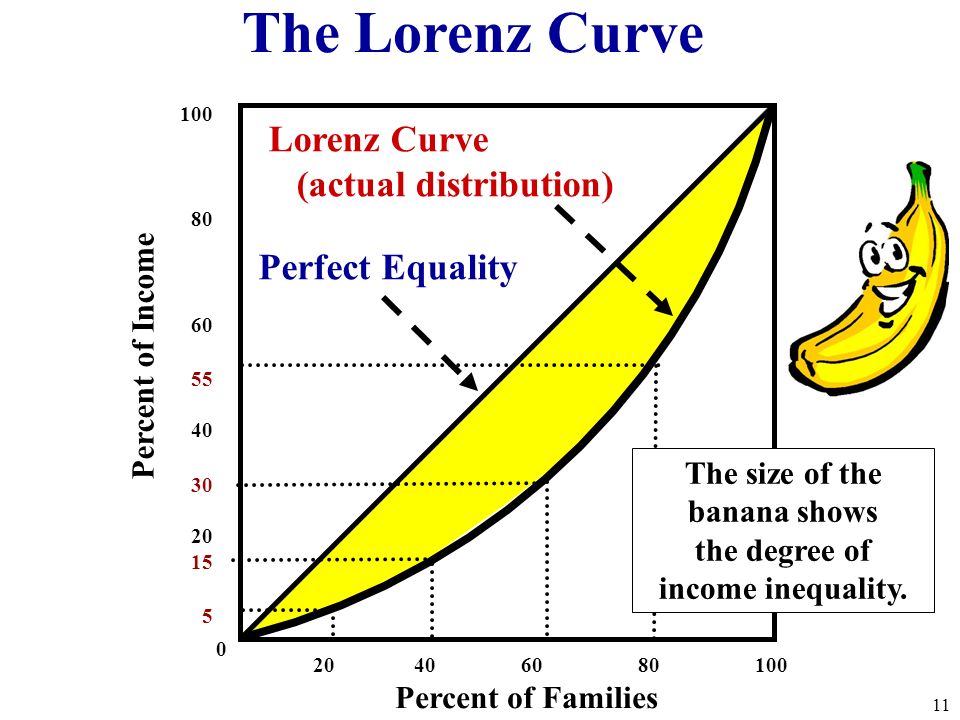
100 80 60 55 40 30 20 15 5 0 Percent of Families Percent of Income Perfect Equality Lorenz Curve (actual distribution) 11 The Lorenz Curve The size of the banana shows the degree of income inequality. 20 40 60 80 100
12
100 80 60 55 40 30 20 15 5 0 Percent of Families Percent of Income Perfect Equality After Distribution 12 The Lorenz Curve The banana gets smaller when the government re- distributes income 20 40 60 80 100

13
The Lorenz Curve is related to the Gini Coefficient The Gini coefficient is usually defined mathematically based on the Lorenz curve, which plots the proportion of the total income of the population (y axis) that is cumulatively earned by the bottom x% of the population (see diagram). The line at 45 degrees thus represents perfect equality of incomes. The Gini coefficient can then be thought of as the ratio of the area that lies between the line of equality and the Lorenz curve (marked A in the diagram) over the total area under the line of equality (marked A and B in the diagram); i.e., G = A / (A + B) 13
 over the total area under the line of equality (marked A and B in the diagram); i.e., G = A / (A + B) 13.")
14
Welfare provides a safety net for citizens (retirement, unemployment, workers comp, health, etc.) BUT, what are some possible downsides? Where does the government get the money for welfare? 14

15
Taxes 15

16
What are Taxes? Why does the government tax? Two purposes: 1.Finance government operations. Public goods-highways, defense, employee wages Fund Programs- welfare, social security 2. Influence economic behavior of firms and individuals. Ex: Excise taxes on tobacco raises tax revenue and discourages the use of cigarettes. Taxes – mandatory payments made to the government to cover costs of governing. 16

17
Three Types of Taxes 1. Progressive Taxes -takes a larger percent of income from high income groups (takes more from rich people). Ex: Current Federal Income Tax system 3. Regressive Taxes –takes a larger percentage from low income groups (takes more from poor people). Ex: Sales tax; any consumption tax. 2. Proportional Taxes (flat rate) –takes the same percent of income from all income groups. Ex: 20% flat income tax on all income groups 17
. Ex: Current Federal Income Tax system 3. Regressive Taxes –takes a larger percentage from low income groups (takes more from poor people). Ex: Sales tax; any consumption tax. 2. Proportional Taxes (flat rate) –takes the same percent of income from all income groups. Ex: 20% flat income tax on all income groups 17.")
18
What kind of taxes are these? (THINK % of Income) 1.Toll road tax ($1 per day) 2.State income tax where richer citizens pay higher % 3.$.45 tax on cigarettes 4.Medicare tax of 1% of every dollar earned 5.6% Michigan sales tax 18 Three Types of Taxes
 1.Toll road tax ($1 per day) 2.State income tax where richer citizens pay higher % 3.$.45 tax on cigarettes 4.Medicare tax of 1% of every dollar earned 5.6% Michigan sales tax 18 Three Types of Taxes.")
19
Federal Income Tax Debate Equal Tax of $350 per week (Regressive Tax) Income Amount of Tax % Amount to live on $200$350 175% - $150 )[crime?] $350$350 100% $0 $500$350 70% $150 $1,000$350 35%$650 $5,000$350 7%$4,650 T ax tax of 20% per week (Proportional Tax) Income Amount of Tax Amount to live on $200$40 $160 $350$70 $280 $500$100 $400 $1,000$200 $800 $5,000$1,000 $4,000 19
![Federal Income Tax Debate Equal Tax of $350 per week (Regressive Tax) Income Amount of Tax % Amount to live on $200$ % - $150 )[crime ] $350$ % $0 $500$350 70% $150 $1,000$350 35%$650 $5,000$350 7%$4,650 T ax tax of 20% per week (Proportional Tax) Income Amount of Tax Amount to live on $200$40 $160 $350$70 $280 $500$100 $400 $1,000$200 $800 $5,000$1,000 $4,000 19](http://images.slideplayer.com/27/9056120/slides/slide_19.jpg "Federal Income Tax Debate Equal Tax of $350 per week (Regressive Tax) Income Amount of Tax % Amount to live on $200$ % - $150 )[crime ] $350$ % $0 $500$350 70% $150 $1,000$350 35%$650 $5,000$350 7%$4,650 T ax tax of 20% per week (Proportional Tax) Income Amount of Tax Amount to live on $200$40 $160 $350$70 $280 $500$100 $400 $1,000$200 $800 $5,000$1,000 $4,000 19")
20
Federal Income Tax Debate This is our current system. Is it fair? The Progressive tax system is the most effective way to fight this market failure

21
21 RateSingle FilersMarried Joint Filers Head of Household Filers 10%$0 to $8,925$0 to $17,850$0 to $12,750 15%$8,925 to $36,250$17,850 to $72,500$12,750 to $48,600 25%$36,250 to $87,850$72,500 to $146,400$48,600 to $125,450 28%$87,850 to $183,250$146,400 to $223,050$125,450 to $203,150 33%$183,250 to $398,350$223,050 to $398,350$203,150 to $398,350 39.6%$400,000 and up$450,000 and up$425,000 and up

22
The Laffer Curve Shows relationship between tax rate and tax revenue. What would happen if the highest tax bracket was 75%? 22 The LAST micro graph to learn!!!!

23
THINK ROBIN HOOD!!!!!! What was his group’s name? Marry Men What did they do? Laugh a lot…they were “Laffers.” What was his weapon of choice? Bow and Arrow What did Robin Hood do? Steal from the rich and give to the poor. What would happen to the amount of travelers through Sherwood forest if he took 95% instead of 39% of their money? What would happen to the total amount of money he collects? 23

24
The Laffer Curve 24 % Tax Rate Tax Revenue If the government increase taxes rates tax revenue will increase If the tax rate becomes too high, tax revenue will fall since workers have no incentive to work harder

25
GREAT NEWS… YOU ARE DONE WITH MICRO!!!! 25

26
Practice FRQs 26

27
27 2005, #2

28
28 2003, #1

Similar presentations


 payroll tax (15.3 % of wage and salary income) corporate income tax (corporate profits) excise.>")


