Download presentation
Presentation is loading. Please wait.

1
HUMAN POPULATION DYNAMICS

2
Chapter Overview Questions What is the history of human population growth, and how many people are likely to be here by 2050? How is population size affected by birth, death, fertility, and migration rates? How is population size affected by percentages of males and females at each age level? How can we slow population growth? What success have India and China had in slowing population growth? What are the major impacts of human activities on the world ’ s natural ecosystems?

3
7 Billion http://www.youtube.com/watch?v=sc4HxPxN rZ0&feature=share&list=PL7WxmjMiAYikNGK PUWeZxBNOhKsd8LxSo

4
Core Case Study: Is the World Overpopulated? The world ’ s population is projected to increase from 6.6 billion to 8.9 billion between 2006 and 2050. (We are already at 7 billion now.) The debate over interactions among population growth, economic growth, politics, and moral beliefs is one of the most important and controversial issues in environmental science.
 The debate over interactions among population growth, economic growth, politics, and moral beliefs is one of the most important and controversial issues in environmental science..")
5
Core Case Study: Is the World Overpopulated? Much of the world ’ s population growth occurs in developing countries like China and India. India will soon overtake China in population Figure 9-1

6
Core Case Study: Is the World Overpopulated? Some argue that the planet has too many people, and eventually we will out grow our resources. Some feel that the world can support billions of more people due to technological advances. There is a constant debate over the need to reduce population growth. Must consider moral, religious, and personal freedom.

7
HUMAN POPULATION GROWTH: A BRIEF HISTORY The human population has grown rapidly because of: the expansion of agriculture, industrial production, and lower death rates from improvements in hygiene and medicine. In 2006, the population of developed countries grew exponentially at 0.1% per year. Developing countries grew (15 times faster at 1.5% per year.

8
Where Are We Headed? We do not know how long we can continue increasing the earth ’ s carrying capacity for humans. There are likely to be between 7.2-10.6 billion people on earth by 2050. 97% of growth in developing countries living in acute poverty. Some developing countries are beginning to aquire greater wealth and produce a high demand on natural resources. What is the optimum sustainable population of the earth based on the cultural carrying capacity?

9
Where Are We Headed? U.N. world population projection based on women having an average of 2.5 (high), 2.0 (medium), or 1.5 (low) children. Figure 9-2
, 2.0 (medium), or 1.5 (low) children. Figure 9-2.")
10
Fig. 9-2, p. 173 High 10.6 Population (billions) High Medium Low 7.2 Medium 8.9 Year
 High Medium Low 7.2 Medium 8.9 Year")
11
Factors that affecting human population size Immigration- individuals moving into a population. Increases populations Ex. (Canadian Geese arriving in the tundra during the spring) Emigration – individuals leaving a population. Decreases populations Ex. (Canadian Geese leaving lakes in the South during the spring)
 Emigration – individuals leaving a population. Decreases populations Ex. (Canadian Geese leaving lakes in the South during the spring).")
12
Factors Affecting Human Population Growth Crude Birth rate – number of births per 1,000 individuals in a period of time. Highest in developing countries Lower in developed countries Crude Death rate – number of deaths born per 1,000 individuals in a period of time. Highest in developing countries Lower in developed countries

13
FACTORS AFFECTING HUMAN POPULATION SIZE Growth Rate- uses birth rate, death rate, immigration, & emigration to calculate population growth/change. Instead of using raw numbers, crude birth rates and crude death rates are used (based on total number of births or deaths per 1,000 people in a population).
..")
14
Growth rate (Birth rate-death rate) + (immigration – emigration) / 10 If a population of 10,000 experiences 100 births, 40 deaths, 10 immigrants and 30 emigrants in a year, what is the net annual percentage growth rate?
 + (immigration – emigration) / 10 If a population of 10,000 experiences 100 births, 40 deaths, 10 immigrants and 30 emigrants in a year, what is the net annual percentage growth rate")
15
Growth Rate Problems Calculate the growth rate for the following population: A population with a crude birth rate of 18 per 1,000, a crude death rate of 10 per 1,000, and immigration rate of 5 per 1,000, and an emigration rate of 7 per 1,000 would have a growth rate of _________. (18/1,000 + 5/1,000) – (10/1,000 + 7/1,000) = 6/1,000 Growth Rate x 100% 6/1,000 x 100% = 0.6%
 – (10/1, /1,000) = 6/1,000 Growth Rate x 100% 6/1,000 x 100% = 0.6%.")
16
Annual Rate of Natural Population Change (%)= Birth rate – Death rate 1,000 people x 100
= Birth rate – Death rate 1,000 people x 100")
17
Doubling Time Doubling time is the amount of time needed for a population to double in size. Doubling Time = 70 / Growth Rate Ex. A population has a growth rate of 2%. How long will it take for the population to double? Doubling Time = 70/2 Doubling Time = 35 years

18
Age Structure: Young Populations Can Grow Fast How fast a population grows or declines depends on its age structure. Prereproductive age: not mature enough to reproduce. Reproductive age: those capable of reproduction. Postreproductive age: those too old to reproduce.

20
Question of the Day The Republic of Congo has a growth rate of 2.83 with a population of 4,492, 689 people. Calculate the amount of time it will take for the population to double. Show your work. Doubling Time= 70/ Growth Rate Doubling Time= 70/ 2.83 Doubling Time= 24. 73 years

21
Population Ecology (Ch5, p125-132, Withgott)
")
22
Population Ecology Exponential Growth- population growth that increases by a fixed percentage each year. Produces a J-shaped curve. Occurs in small populations or when conditions are ideal Logistic Growth- population growth rises sharply but will begin to level off. Environmental resistance forces that limit the growth/size of the population at the carrying capacity.

23
Biotic Potential Maximum reproductive rate of an organism. Of course there are limiting factors for a population. For example the common housefly can lay 120 eggs in each generation. If nothing hurt the eggs or the flies, in 7 generations there would be 6,182,442,727,320 flies.

24
Limits on Population Growth: Biotic Potential vs. Environmental Resistance No population can increase its size indefinitely. The intrinsic rate of increase (r) is the rate at which a population would grow if it had unlimited resources. Carrying capacity (K): the maximum population of a given species that a particular habitat can sustain indefinitely without degrading the habitat.
 is the rate at which a population would grow if it had unlimited resources. Carrying capacity (K): the maximum population of a given species that a particular habitat can sustain indefinitely without degrading the habitat..")
25
Exponential and Logistic Population Growth: J-Curves and S-Curves Populations grow rapidly with ample resources, but as resources become limited, its growth rate slows and levels off. Figure 8-4

26
Exponential and Logistic Population Growth: J-Curves and S-Curves As a population levels off, it often fluctuates slightly above and below the carrying capacity. Figure 8-4

27
Exceeding Carrying Capacity: Move, Switch Habits, or Decline in Size Over time species may increase their carrying capacity by developing adaptations. Some species maintain their carrying capacity by migrating to other areas. So far, technological, social, and other cultural changes have extended the earth ’ s carrying capacity for humans.

28
Population Density and Population Change: Effects of Crowding Population density: the number of individuals in a population found in a particular area or volume. A population ’ s density can affect how rapidly it can grow or decline. (Density Dependent Factors) e.g. biotic factors like disease Some population control factors are not affected by population density. (Density Independent Factors) e.g. abiotic factors like weather/natural disasters
 e.g. biotic factors like disease Some population control factors are not affected by population density. (Density Independent Factors) e.g. abiotic factors like weather/natural disasters.")
29
Reproductive Patterns: Opportunists and Competitors Large number of smaller offspring with little parental care (r-selected species). Fewer, larger offspring with higher invested parental care (K- selected species). Figure 8-9
. Figure 8-9.")
30
Reproductive Patterns r-selected species tend to be opportunists while K-selected species tend to be competitors. Figure 8-10

31
Fig. 8-10a, p. 168 Many small offspring Little or no parental care and protection of offspring Early reproductive age Most offspring die before reaching reproductive age Small adults Adapted to unstable climate and environmental conditions High population growth rate (r) Population size fluctuates wildly above and below carrying capacity (K) Generalist niche Low ability to compete Early successional species r-Selected Species Cockroach Dandelion
 Population size fluctuates wildly above and below carrying capacity (K) Generalist niche Low ability to compete Early successional species r-Selected Species Cockroach Dandelion.")
32
Fig. 8-10b, p. 168 Fewer, larger offspring High parental care and protection of offspring Later reproductive age Most offspring survive to reproductive age Larger adults Adapted to stable climate and environmental conditions Lower population growth rate (r) Population size fairly stable and usually close to carrying capacity (K) Specialist niche High ability to compete Late successional species K-Selected Species SaguaroElephant
 Population size fairly stable and usually close to carrying capacity (K) Specialist niche High ability to compete Late successional species K-Selected Species SaguaroElephant.")
33
Survivorship Curves: Short to Long Lives The populations of different species vary in how long individual members typically live. (Type, 1, 2,3) Figure 8-11
 Figure")
34
Survivorship Curves All individuals in a population eventually die. Survivorship curves are graphs that show the likelihood at a given age. Types of Survivorship Curves Type I (Late Loss)- mostly K species Type II (Constant Loss) Type III (Early Loss) – mostly r species
- mostly K species Type II (Constant Loss) Type III (Early Loss) – mostly r species.")
35
Fig. 8-11, p. 169 Percentage surviving (log scale) Age Early loss (Type III) Late loss (Type I ) Constant loss (Type II )
 Age Early loss (Type III) Late loss (Type I ) Constant loss (Type II ).")
36
r & K Selection http://www.youtube.com/watch?v=Bu6ouKt9zhs&fea ture=share&list=PL7WxmjMiAYikNGKPUWeZxBNOhKs d8LxSo

37
Question of the Day A population of 100,000 frogs experiences 1800 birth per year, 600 death, 200 immigrants, and 400 emigrants. What would be its growth rate in percent per year? A. 0.5 B. 1.0 C. 1.5 D. 2.0 E. 2.5

38
Factors Affecting Human Population Size

39
Demography Demography is the study of human populations. Information & Data are used to study human: immigration & emigration, population size, density, distribution, age structure, birth rates, and death rates.

40
Developed vs. Developing Countries In the past demographers have placed countries into two categories: developed and developing. Developed Countries – have a very strong varied industrial economies, stable infrastructure, and stable population size. (low birth rate) Developing Countries – have agrarian economies, little or not infrastructure, and unstable population size (high birth rate)
 Developing Countries – have agrarian economies, little or not infrastructure, and unstable population size (high birth rate).")
41
Developing Countries- China is the largest but has taken drastic population control methods. By 2050, India is predicted to pass it. Pakistan is projected to become 3 rd with Iran and Ethiopia following. However, Russia is losing 600,000 people a year, after being the 4 th largest country in 1950. This is because of environmental pollution, hyperinflation, crime, corruption, disease and despair.

42
FACTORS AFFECTING HUMAN POPULATION SIZE Average crude and birth rates for various groupings of countries in 2006. Figure 9-3

43
Fig. 9-3, p. 174 Average crude death rate Average crude birth rate World 21 9 All developed countries 11 10 All developing countries 27 8 9 23 Developing countries (w/o China)
.")
44
Fig. 9-3, p. 174 14 Europe North America United States Oceania Asia Africa Latin and Central America 38 15 21 6 20 7 17 7 14 8 8 11 10

45
FACTORS AFFECTING HUMAN POPULATION SIZE The world ’ s 10 most populous countries in 2006 with projections in 2025. Figure 9-4

46
Fig. 9-4, p. 174 2025 1.5 billion China 1.3 billion India 1.1 billion 1.4 billion USA 300 million 349 million Indonesia225 million 264 million Brazil 187 million 229 million Pakistan166 million 229 million Bangladesh 147 million 190 million Russia 142 million 130 million 135 million Nigeria 199 million Japan 121 million 128 million 2006

47
POPULATION AGE STRUCTURE The number of people in young, middle, and older age groups determines how fast populations grow or decline. The number of people younger than age 15 is the major factor determining a country ’ s population growth. Changes in the distribution of a country ’ s age groups have long-lasting economic and social impacts.

48
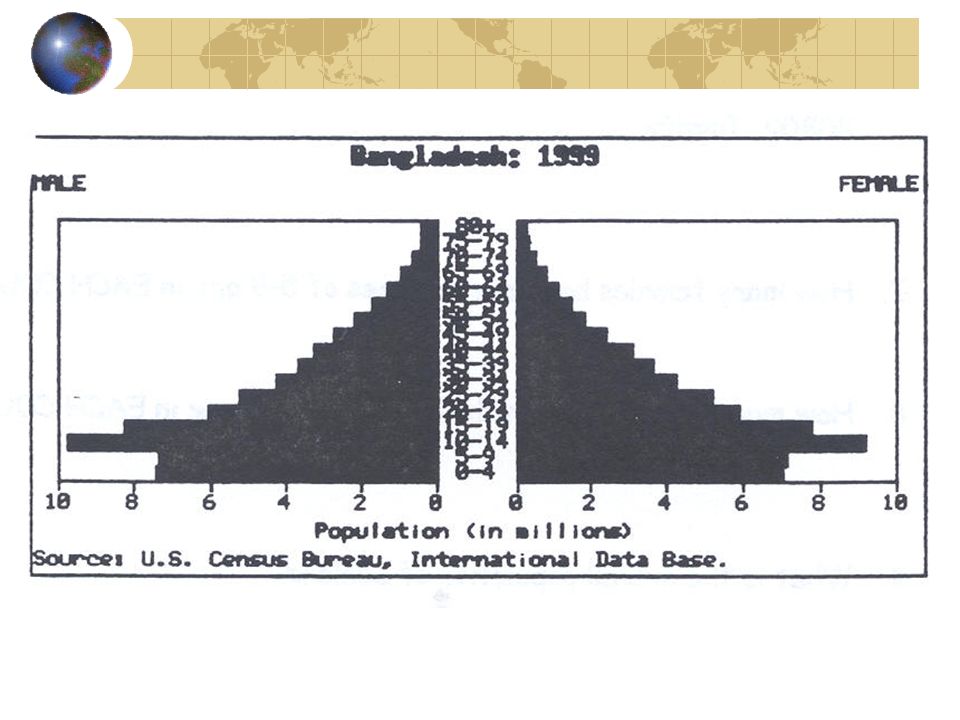
POPULATION AGE STRUCTURE Populations with a large proportion of its people in the prereproductive ages 1-14 have a large potential for rapid population growth. Figure 9-9

49
Fig. 9-9, p. 179 Expanding Rapidly Guatemala Nigeria Saudi Arabia Expanding Slowly United States Australia Canada Stable Spain Portugal Greece Declining Germany Bulgaria Italy Prereproductive ages 0–14 Reproductive ages 15– 44 Postreproductive ages 45–85+ FemaleMale Female

50
POPULATION AGE STRUCTURE 32% of the people in developing countries were under 15 years old in 2006 versus only 17% in developed countries. Figure 9-10

51
Fig. 9-10a, p. 179 Female Age Population (millions) Developed Countries Male
 Developed Countries Male")
52
Fig. 9-10b, p. 179 Female Age Population (millions) Developed Countries Male
 Developed Countries Male")
53
POPULATION AGE STRUCTURE Today, baby boomers make up nearly half of all adult Americans and dominate the populations demand for goods and services. Figure 9-11

54
Expansive/rapid growth Birth rate exceeds the death rate. Population is getting larger. Pyramid shaped histogram. Ex ’ s. Kenya, Nigeria and Saudi Arabia.

56
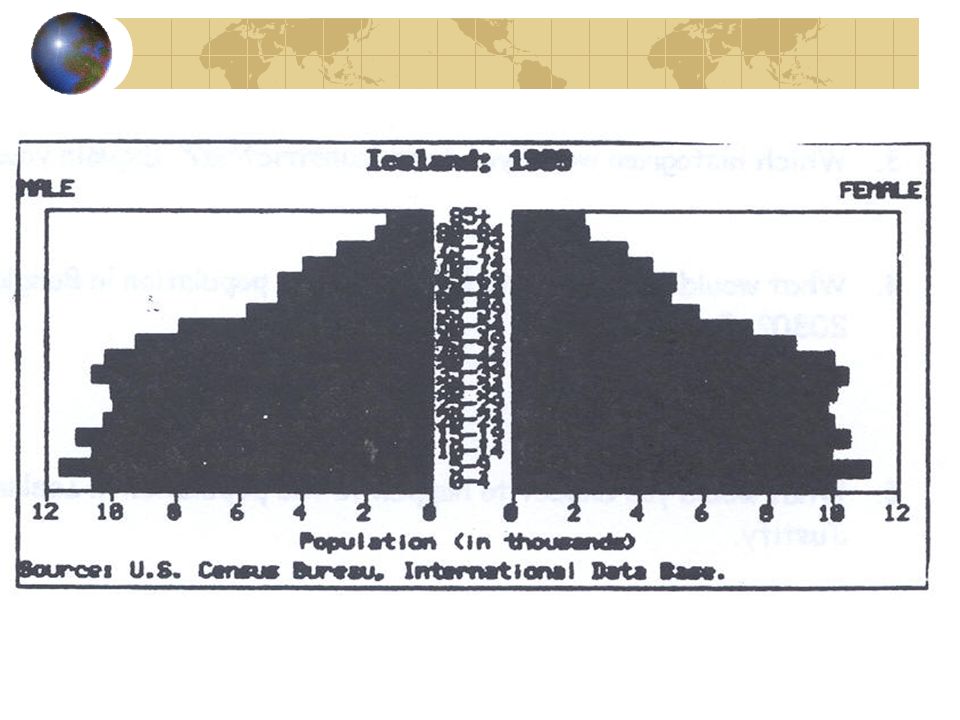
Stable/Slow Growth (Zero Growth) Birth rate almost equals death rate. The population is not getting any larger or is growing very slowly. Histogram shape is straighter and more box-like until about age 45-85. Ex. US, Australia & Canada has slow Denmark, Austria and Italy has stable

58
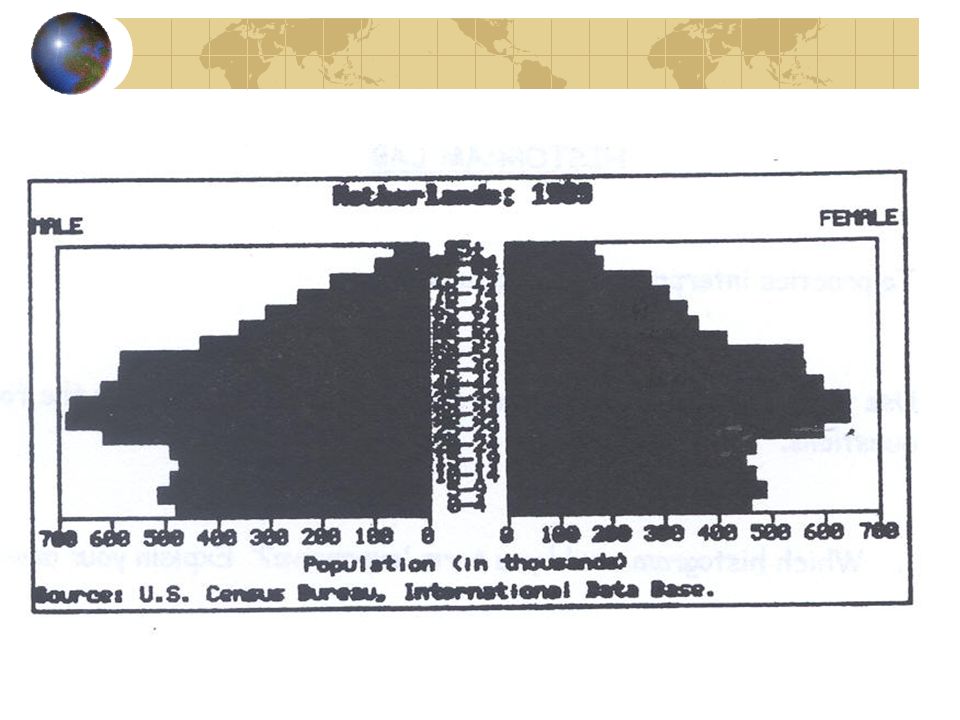
Declining (negative growth) When the birth rate is smaller than the death rate. The pyramid bulges near the top or is inverted. Ex. Germany, Bulgaria & Hungary.

60
Hans Rosling: Population Growth, Box by Box. https://www.youtube.com/watch?v=fTz nEIZRkLg&feature=share&list=PL7Wxm jMiAYikNGKPUWeZxBNOhKsd8LxSo

61
Declining Fertility Rates: Fewer Babies per Women The average number of children that a woman bears has dropped sharply. This decline is not low enough to stabilize the world ’ s population in the near future. Replacement-level fertility: the number of children a couple must bear to replace themselves. Total fertility rate (TFR): the average number of children a woman has during her reproductive years.
: the average number of children a woman has during her reproductive years..")
62
Case Study: Fertility and Birth Rates in the United States Nearly 2.9 million people were added to the U.S. in 2006: 59% occurred because of births outnumbering deaths. 41% came from illegal and legal immigration.

63
Case Study: Fertility and Birth Rates in the United States In 2006, the total fertility rate in the United States was slightly > 2.0 Figure 9-5

64
Fig. 9-5, p. 175 Replacement Level Year Births per woman Baby boom (1946–64)
")
65
Population Explosion Anything that causes the population to grow uncontrollably. Ex. Baby boom. 78 Million person increase between 1946- 1964 (Men came home from the war. These people all had children and so this increase will continue to move up through the country ’ s age structure as members of this group grow older)
.")
66
Case Study: Fertility and Birth Rates in the United States The baby bust that followed the baby boom was largely due to delayed marriage, contraception, and abortion. Figure 9-6

67
Fig. 9-6, p. 175 Demographic transition Depression End of World War II Baby boom Baby bust Echo baby boom Births per thousand population Year

68
Question of the Day A population of 300 deer increases to 400 deer, the percent change in the population is _________. % Change = New Pop. – Old Pop. x100 Old Pop. A.3% B.33% C.300% D.50% E.25%

69
Question of the Day Which of the following is the best description of a population that has a stable age distribution? A. A large population that is growing at a constant rate B. A large population with a negative growth rate C. A population that is in the early stages of logistic population growth D. A growing population in which the proportions of individuals in the different age classes remain constant E. A small population that has not yet achieved exponential growth

70
Population & Society

71
SOLUTIONS: INFLUENCING POPULATION SIZE Demographic Transition: As countries become economically developed, their birth and death rates tend to decline. Preindustrial stage: little population growth due to high infant mortality. Transitional stage: industrialization begins, death rates drops and birth rates remain high. Industrial stage: birth rate drops and approaches death rate.

72
SOLUTIONS: INFLUENCING POPULATION SIZE Generalized model of demographic transition. Some developing countries may have difficulty making the demographic transition. Figure 9-14

73
Fig. 9-14, p. 183 Birth rate Death rate Total population Stage 1 Preindustrial Stage 2 Transitional Stage 3 Industrial Stage 4 Postindustrial Growth rate over time Birth rate and death rate (number per 1,00 per year) Relative population size Low Increasing Very highDecreasing Zero Negative High
 Relative population size Low Increasing Very highDecreasing Zero Negative High.")
74
Demographic stages in countries- As countries becomes industrialized their birth rates decline.

75
Pre-industrial Harsh living conditions lead to a high birth rate and high death rate. Thus, there is little population growth.

76
Transitional As industrialization begins, food production rises and health care improves. Death rates drop and birth rates remain high The population grows rapidly

77
Industrial Industrialization is wide spread The birth rate drops and eventually approaches the death rate. This is because of: better access to birth control decline in the infant mortality rate increased job opportunities for women the high cost of raising children who don ’ t enter the work force until after high school or college.

78
Postindustrial The birth rate declines even further, equaling the death rate and thus reaching zero population growth. Then, the birth rate falls below the death rate and the total population size slowly decreases. (Cont….)
.")
79
37 countries have reached this stage. (mainly in W. Europe) To most population experts, the challenge is to help the remaining 88% of the world to get to this stage.
 To most population experts, the challenge is to help the remaining 88% of the world to get to this stage..")
80
Question of the Day As a country goes through the demographic transition, the greatest rate of population growth takes place during which phase? A. The preindustrial B. The pretransitional C. The transitional D. The industrial E. The postindustrial

81
Factors Affecting Birth Rates and Fertility Rates The number of children women have is affected by: The cost of raising and educating them. Availability of pensions. Urbanization. Education and employment opportunities. Infant deaths. Marriage age. Availability of contraception and abortion.

82
Fig. 9-7, p. 176 47 years Homicides per 100,000 people Hourly manufacturing job wage (adjusted for inflation) Living in suburbs Homes with electricity Homes with flush toilets High school graduates Married women working outside the home Life expectancy 1.2 5.8 $15 $3 52% 10% 99% 2% 98% 10% 83% 15% 81% 2000 1900 8% 77 years
 Living in suburbs Homes with electricity Homes with flush toilets High school graduates Married women working outside the home Life expectancy $15 $3 52% 10% 99% 2% 98% 10% 83% 15% 81% % 77 years.")
83
Factors Affecting Death Rates Death rates have declined because of: Increased food supplies, better nutrition. Advances in medicine. Improved sanitation and personal hygiene. Safer water supplies. U.S. infant mortality is higher than it could be (ranked 46 th world-wide) due to: Inadequate pre- and post-natal care for poor. Drug addiction. High teenage birth rate.
 due to: Inadequate pre- and post-natal care for poor. Drug addiction. High teenage birth rate..")
84
Case Study: U.S. Immigration Since 1820, the U.S. has admitted almost twice as many immigrants and refugees as all other countries combined. Figure 9-8

85
U.S. Statistics Because of the ‘ Baby Boom ’ the US has a bulge in the pyramid with people in their 50 ’ s-60 ’ s. There are also more women than men in the older age group because of differences in longevity between the sexes. (Cont…)
.")
86
The US has a high % of retired people because of long life expectancy. This makes us realize the importance of social security, etc. The economy is now geared towards this population The US is considered a slow growth population.

87
Thomas Malthus He argues that rising wages and improved well- being would lead to excess reproduction among the working class. A labor surplus would then cause wages to fall below subsistence levels, resulting in starvation, disease and crime. In his view, land for food production was the limiting factor in both population growth and economic development.

88
Human predictions If there was a continued growth and not death, food would run short and available space would run out. But, humans can ’ t reproduce as fast as other animals. This helps to stop the growth.

89
Gross National Product- The most commonly used measure of the economic growth of a country.

90
Infant mortality rate- Number of child/infant deaths. If a mother lives in an area with a high infant mortality rate she will tend to have a lot of children to ensure some will make it to adulthood.

91
Zero Population Growth- When the number of births, equals the number of deaths. No growth in the population. Total Fertility Rate- an estimate of the average number of children a women will have during her childbearing years.

92
Replacement-level fertility- the number of children a couple must bear to replace themselves. It is slightly higher than two children per couple. (2.2 in developed countries and as high as 2.5 in some developing countries) It is greater in countries w/ high infant mortality rates than in countries w/ low infant mortality rates
 It is greater in countries w/ high infant mortality rates than in countries w/ low infant mortality rates.")
93
Age structure- Percentage of the population at each age level in a population Generation time- the time it takes for 1 generation to pass.

94
Question of the Day It has recently been estimated that the growth in world population has slowed in the past decade. Despite this trend, environmentalists remain concerned about the environmental impact of world population, principally because A. the standard of living is increasing in many developing countries, leading to an increased per capita use of natural resources B. people are living longer in developed nations, putting a strain on the economies of those countries C. life expectancy is still decreasing in Africa due to AIDS D. the standard of living is poor in many developing countries, leading to a great deal of deprivation and suffering E. fertility is falling due to exposure to endocrine disruptors released into the environment

95
Environmental Impact of Human Population Growth

96
Environmental Impact Equation (Paul Ehrlich Formula) IPAT model gives us a way to think about factors that affect environmental quality. Total Impact (I) = Population(P) x Affluence (A) x technology (T) A sensitivity factor (S) can be added to denote how sensitive a environment is to human pressures. I = P x A x T x S
 = Population(P) x Affluence (A) x technology (T) A sensitivity factor (S) can be added to denote how sensitive a environment is to human pressures. I = P x A x T x S.")
97
Developed Countries High rates of resource use Result in high levels of pollution and environmental degradation per person These are believed to be the key factors determining overall environmental impact. Developed countries have much higher carbon & ecological footprints then developed countries.

98
It is estimated that a US citizen consumes 35 X ’ s as much as the average citizen of India and 100 X ’ s as much as the average person in the world ’ s poorest countries. (Cont…)
.")
99
Thus, poor parents in a developing country would need 70-200 kids to have the same lifetime environmental impact as 2 typical US kids. Ex. Figure 8.22 p 227 (WithGott)
.")
100
Urbanization What happens? Strains the cities infrastructure. Roads, sewers, education, trash pick up. Results in: Slums, fecal snow, water borne disease This problem doesn ’ t exist too much in the US because of better working & housing conditions & air and water quality being improved. (Cont….)
.")
101
Urban areas must import most of its food, water, energy, minerals, & other resources. They produce enormous quantities of wastes that can pollute the air, water & land. 44% of the world ’ s people live in urban areas that occupy only 5% of the world ’ s land & they consume 75% of the world ’ s resources.

102
Reasons World Hunger Unequal distribution of available food Loss of arable land Increasing population growth rate Increasing poverty in developing countries Inability to buy food (Poverty)
")
103
Question of the Day Which of the following is a true statement about replacement-level fertility? A. It equals the average number of children a woman will give birth to during her child-bearing years. B. It equals the annual number of live births per 1,000 people in a population. C. It equals the natural increase of a population in one year. D. It is found by subtracting the number of emigrants from the number of immigrants in one year. E. It is greater in countries with high infant-mortality rates than in countries with low infant-mortality rates.

104
Slowing Human Population Growth

105
SLOWING POPULATION GROWTH IN INDIA AND CHINA For more than five decades, India has tried to control its population growth with only modest success. Since 1970, China has used a government-enforced program to cut its birth rate in half and sharply reduce its fertility rate.

106
Fig. 9-15, p. 186 Total fertility rate Percentage of world population Population Population (2050) (estimated) Illiteracy (% of adults) Population under age 15 (%) Population growth rate (%) 17% 20% 1.1 billion 1.3 billion 1.6 billion India China GDP PPP per capita Percentage living below $2 per day Life expectancy 47% 17% 36% 20% 1.6% 0.6% 1.4 billion $5,890 $3,120 47 80 70 years 62 years 27 58 1.6 children per women (down from 5.7 in 1972) Infant mortality rate 2.9 children per women (down from 5.3 in 1970)
 (estimated) Illiteracy (% of adults) Population under age 15 (%) Population growth rate (%) 17% 20% 1.1 billion 1.3 billion 1.6 billion India China GDP PPP per capita Percentage living below $2 per day Life expectancy 47% 17% 36% 20% 1.6% 0.6% 1.4 billion $5,890 $3, years 62 years children per women (down from 5.7 in 1972) Infant mortality rate 2.9 children per women (down from 5.3 in 1970).")
107
India ’ s Failed Family Planning Program Poor planning. Bureaucratic inefficiency. Low status of women. Extreme poverty. Lack of administrative financial support. Disagreement over the best ways to slow population growth.

108
China ’ s Family Planning Program Currently, China ’ s TFR is 1.6 children per women. China has moved 300 million people out of poverty. Problems: Strong male preference leads to gender imbalance. Average population age is increasing. Not enough resource to support population.

109
Some countries, including China, penalize couples who have more than one or two children by: 1.Raising their taxes 2.Charging other fees 3.Eliminating income tax deductions for a couple ’ s third child 4.Loss of health-care benefits, food allotments and job options

110
In China couples who pledge to have no more than one child receive 1.Extra food 2.Larger pensions 3.Better housing 4.Free medical care 5.Salary bonuses 6.Free school tuition for their one child 7.Preferential treatment in employment when their child enters the job market.

111
However, according to some studies, there is a strong preference for male children. 1.Girls are aborted at a higher rate than boys 2.Some infant girls are killed 3.Male children sometimes are fed better than female children.

112
Strategies for ensuring adequate nutrition for a growing population: Increase the number of new food crops from a diversity of plant species Distribute food more equitably Increase land are that is dedicated to grain production rather than meat production Assist developing countries in efficient crop irrigation systems.

113
Fertility rates & reduction Environmental pressures of urbanization from population growth are reduced because birth rates in urban areas usually are 3- 4 X ’ s lower than in rural areas. Cities provide education opportunities.

114
SOLUTIONS: INFLUENCING POPULATION SIZE Family planning has been a major factor in reducing the number of births and abortions throughout most of the world. Women tend to have fewer children if they are: Educated. Hold a paying job outside the home. Do not have their human right suppressed.

115
SOLUTIONS: INFLUENCING POPULATION SIZE The best way to slow population growth is a combination of: Investing in family planning. Reducing poverty. Elevating the status of women.

116
Factors that affect birth & fertility rates Importance of kids in labor force Urbanization Cost of raising & educating kids Availability of private & public pensions Religious beliefs, traditions & cultural norms Educational & employment opportunities Infant mortality rate Average age at marriage Availability of reliable birth control

118
HIV/AIDS and Africa’s Population Increases mortality rates 40 million people in the world have HIV 27 million live in sub-Saharan Africa Low contraception use coupled with high fertility causes the virus to spread rapidly High infant mortality causes the life expectancy to stay low. Create a large number of orphaned children

119
International Efforts 1994 Global Summit on Population & Development Cairo, Egypt Encouraged action to stabilized the world ’ s population at 7.8 billion by 2050, instead of the projected 11-12.5 billion.

120
The major goals are to: Provide universal access to family-planning services. Improve the health care of infants, children & pregnant women Encourage development of national population policies Improving the status of women by expanding education & job opportunities

121
Major goals continued: Increase access to education for girls Increase men ’ s involvement in child- rearing responsibility & family planning Take steps to eradicate poverty Reduce & eliminate unsustainable patterns of production & consumption.

122
Declining Fertility Rates: Fewer Babies per Women The replacement level to sustain a population is 2.0 children. In 2006, the average global Total Fertility Rate was 2.7 children per woman. 1.6 in developed countries (down from 2.5 in 1950). 3.0 in developing countries (down from 6.5 in 1950).
. 3.0 in developing countries (down from 6.5 in 1950)..")
123
HUMAN ASPECTS ON NATURAL SYSTEMS We have used technology to alter much of the rest of nature in ways that threaten the survival of many other species and could reduce the quality of life for our own species. Figure 9-17

124
Fig. 9-17, p. 188 Reduction of biodiversity Increasing use of the earth's net primary productivity Increasing genetic resistance of pest species and disease-causing bacteria Elimination of many natural predators Deliberate or accidental introduction of potentially harmful species into communities Using some renewable resources faster than they can be replenished Interfering with the earth's chemical cycling and energy flow processes Relying mostly on polluting fossil fuels Natural Capital Degradation Altering Nature to Meet Our Needs

Similar presentations


 Estimated 2.4 billion more people by 2050 Are there.>")
 G. Tyler Miller’s.>")


