Download presentation
Presentation is loading. Please wait.

1
Chapter 3 Data Description Section 3-2 Measures of Central Tendency

2
Chapter 1 stated that statisticians use samples taken from populations; however, when populations are small, it is not necessary to use samples since the entire population can be used to gain information. For example, suppose an insurance manager wanted to know the average weekly sales of all the company’s representatives. If the company employed a large number of salespeople, say, nationwide, he would have to use a sample and make an inference to the entire sales force. But if the company had only a few salespeople, say, only 87 agents, he would be able to use all representatives’ sales for a randomly chosen week and thus use the entire population.

3
A statistic is a characteristic or measure obtained by using the data values from a sample. A parameter is a characteristic or measure obtained by using all the data values from a specific population.

4
The Mean The mean, also known as the arithmetic average, is found by adding the values of the data and dividing by the total number of values.

5
Procedure Table

6
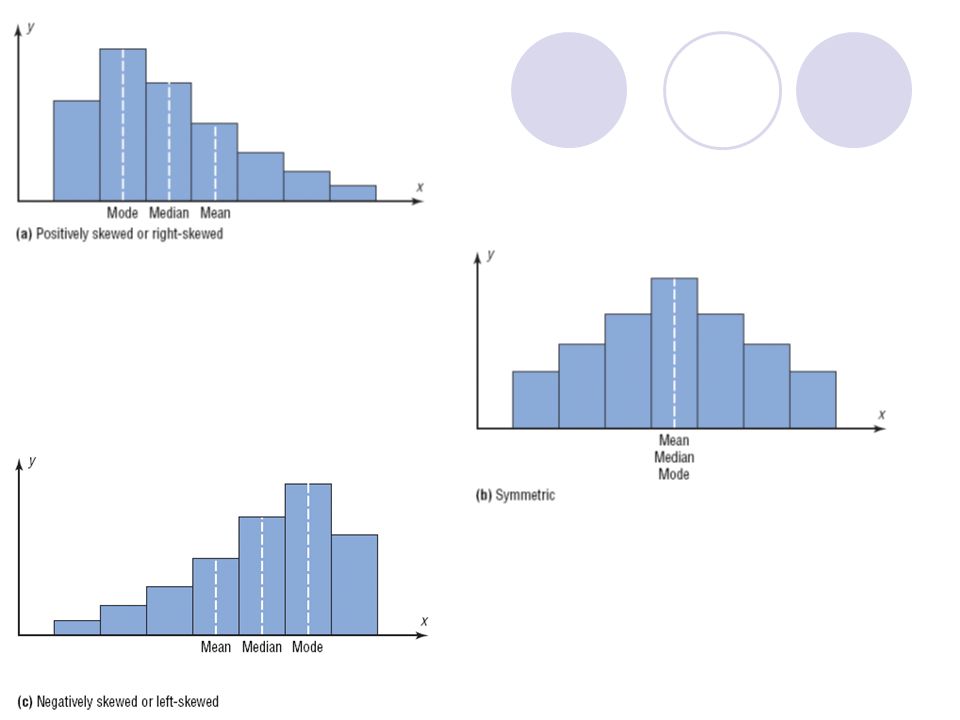
The Median The median is the halfway point in a data set. Before one can find this point, the data must be arranged in order. When the data set is ordered, it is called a data array. The median either will be a specific value in the data set or will fall between two values The median is the midpoint of the data array. The symbol for the median is MD.

7
The Mode The third measure of average is called the mode. The mode is the value that occurs most often in the data set. If a data set has two values that occur with the same greatest frequency, both values are considered to be the mode and the data set is said to be bimodal. If a data set has more than two values that occur with the same greatest frequency, each value is used as the mode, and the data set is said to be multimodal.

8
The Midrange The midrange is defined as the sum of the lowest and highest values in the data set, divided by 2. The symbol MR is used for the midrange. The midrange is a rough estimate of the middle. It is found by adding the lowest and highest values in the data set and dividing by 2. It is a very rough estimate of the average and can be affected by one extremely high or low value.

9
The Weighted Mean Sometimes, one must find the mean of a data set in which not all values are equally represented.

10
Summary of Measures of Central Tendency

11
Properties and Uses of Central Tendency The Mean 1. One computes the mean by using all the values of the data. 2. The mean varies less than the median or mode when samples are taken from the same population and all three measures are computed for these samples. 3. The mean is used in computing other statistics, such as the variance. 4. The mean for the data set is unique and not necessarily one of the data values. 5. The mean cannot be computed for the data in a frequency distribution that has an open-ended class. 6. The mean is affected by extremely high or low values, called outliers, and may not be the appropriate average to use in these situations.

12
Properties and Uses of Central Tendency The Median 1. The median is used when one must find the center or middle value of a data set. 2. The median is used when one must determine whether the data values fall into the upper half or lower half of the distribution. 3. The median is used for an open-ended distribution. 4. The median is affected less than the mean by extremely high or extremely low values.

13
Properties and Uses of Central Tendency The Mode 1. The mode is used when the most typical case is desired. 2. The mode is the easiest average to compute. 3. The mode can be used when the data are nominal, such as religious preference, gender, or political affiliation. 4. The mode is not always unique. A data set can have more than one mode, or the mode may not exist for a data set.

14
Properties and Uses of Central Tendency The Midrange 1. The midrange is easy to compute. 2. The midrange gives the midpoint. 3. The midrange is affected by extremely high or low values in a data set.

16
Section 3-2 Exercise #3

19
Section 3-2 Exercise #5 Find (a) the mean, (b) the median, (c) the mode, and (d) the midrange.
 the mean, (b) the median, (c) the mode, and (d) the midrange.")
21
5107.5-118.5 1496.5-107.5 1885.5-96.5 2574.5-85.5 1263.5-74.5 652.5-63.5 FrequencyClass Boundaries Section 3-2 Exercise #17

22
107.5 – 118.5 96.5 – 107.5 85.5 – 96.5 74.5 – 85.5 63.5 – 74.5 52.5 – 63.5 Boundaries 12 6 25 18 14 5 modal class:

Similar presentations