Download presentation
Presentation is loading. Please wait.

1
Introduction to Process Technology Principles of Quality

2
Today’s Agenda Quality – I’ll Know It When I See It Current Issues and Trends Pioneers of Quality Total Quality Management (TQM) –The Production Line Activity Quality Cycle International Standards Organization (ISO) Statistical Process Control (SPC) –You Be the Expert Six Sigma Supporting Quality – Role of Proc Tech
 –The Production Line Activity Quality Cycle International Standards Organization (ISO) Statistical Process Control (SPC) –You Be the Expert Six Sigma Supporting Quality – Role of Proc Tech")
3
Quality – What it Means to Me List your expectations for quality as a customer List your expectations as a member of a plant community List your expectations of quality as a potential plant employee List your expectations of quality as a potential investor (stockholder)
")
4
Quality Product or service free of deficiencies Characteristics of a product or service that bear on its ability to satisfy stated or implied needs

5
Industry Responses Total Quality Management (TQM) ISO-9000 Series ISO-14000 Series (environmental) Six Sigma Statistical Process Control (SPC) Self-directed or Self-managed Work Teams
 ISO-9000 Series ISO Series (environmental) Six Sigma Statistical Process Control (SPC) Self-directed or Self-managed Work Teams")
6
Pioneers of Quality Dr. W. Edward Deming – every job or every task is part of a process Joseph Juran – Pareto Principle of 80/20 Philip Crosby – Zero Defects

7
Total Quality Management (TQM) Customer Focus Continuous Improvement Manage by Data and Facts Empower Employees
 Customer Focus Continuous Improvement Manage by Data and Facts Empower Employees")
8
Quality Improvement Cycle Phase 1: PLAN –Increase current knowledge of process –Specific objectives, questions, make predicitons, and propose plan for testing –Outcome of plan should consider methods, resources, schedules, and people

9
Quality Improvement Cycle Phase 2: OBSERVE & ANALYZE –Implements data collection process to address questions from Phase 1. –Reveals what is actually happening and can lead to refinement of initial questions

10
Quality Improvement Cycle Phase 3: LEARN –Combines activities from Phase 1 & 2 –Results of data analysis are compared to current knowledge and theories to see there are any contradictions

11
Quality Improvement Cycle Phase 4: ACT –Results from Phase 3 are used to decide whether to make changes to process or not. –If change is indicated, brainstorming session can be conducted to determine what changes would result in improvement

12
TQM Applied The Production Line Activity (see handout)
")
13
International Organization of Standardization (ISO) Founded after WW II. Headquartered in Geneva, Switzerland Voluntary, non-governmental Global standards of product and service quality that aims to maintain quality standards and fixed defects and ensure repeated acceptable performance

14
ISO & TQM Overlapping expectations TQM is defined in many ways, while ISO standards are consistent ISO world-wide, TQM more US based

15
Why Companies Seek ISO Certification Contractual – requirement of suppliers Liability – improved product liability procedures and documentation Cost savings – increased efficiency, less product loss Competition – global advantage for large and small companies Customer Satisfaction – increased by certification

16
ISO in the Processing Industry Continuous Improvement Statistical Process Control (SPC) Process Technicians & Quality Global Market
 Process Technicians & Quality Global Market")
17
Statistical Process Control (SPC) Statistical Process Control – using data-driven methodology to control a process STATISTICAL –With the help of numbers PROCESS –We study the characteristics of our process CONTROL –To make it behave the way we want it to behave
 Statistical Process Control – using data-driven methodology to control a process STATISTICAL –With the help of numbers PROCESS –We study the characteristics of our process CONTROL –To make it behave the way we want it to behave")
18
SPC Product Directives – following the “recipe” –Correct feed –Temperature and pressure profile –Equipment speed –Additive setpoint –Level and flow setpoints

19
SPC Sample Types – –Raw materials –Additives –Intermediates –End products

20
SPC Data Types Attributes – called discrete data. Data that can be counted and plotted as distinct or unconnected events. –Percentage of late shipments –Number of mistakes made during a process

21
SPC Data Types Variables – called continuous data. Data that can be measured and plotted on a constant scale. –Flow through a pipeline –Volume in a tank

22
SPC – Select Proper Category DataAttributeVariable Pounds per square inch (pressure) Gallons per minute Temperature reading Bad batches per shift Flow through a pipe Downtime for equipment Days lost to accidents Level in tank Amount of electricity used Percent of delayed deliveries
 Gallons per minute Temperature reading Bad batches per shift Flow through a pipe Downtime for equipment Days lost to accidents Level in tank Amount of electricity used Percent of delayed deliveries")
23
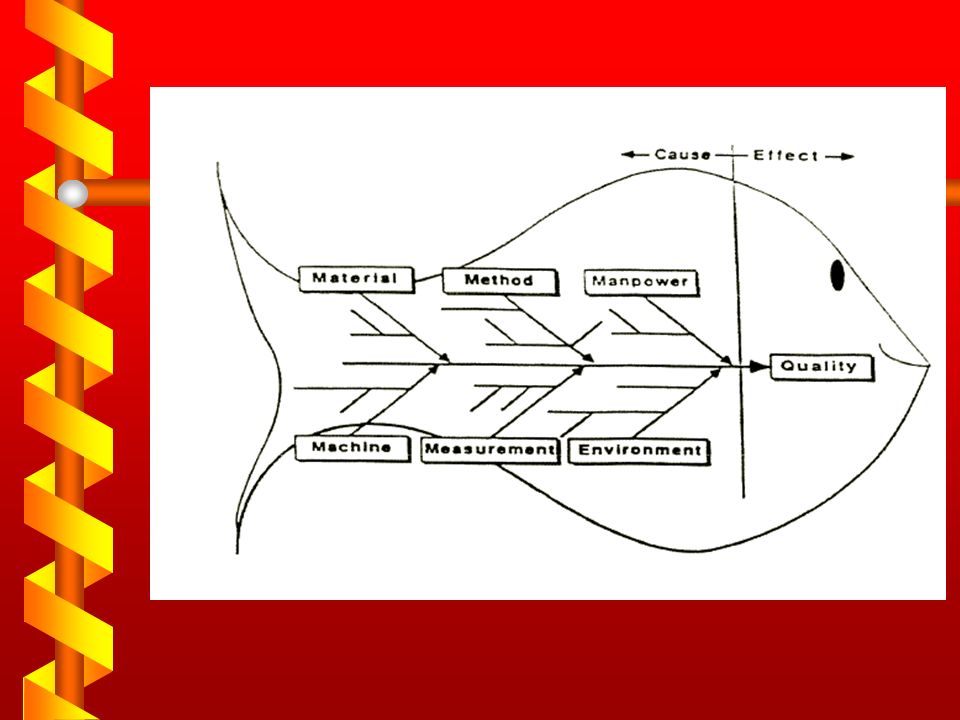
Quality Control Tools Control Charts Flow Charts Cause and Effects Diagrams, Fishbone Pareto Charts Histograms Scatter Plots Others

24
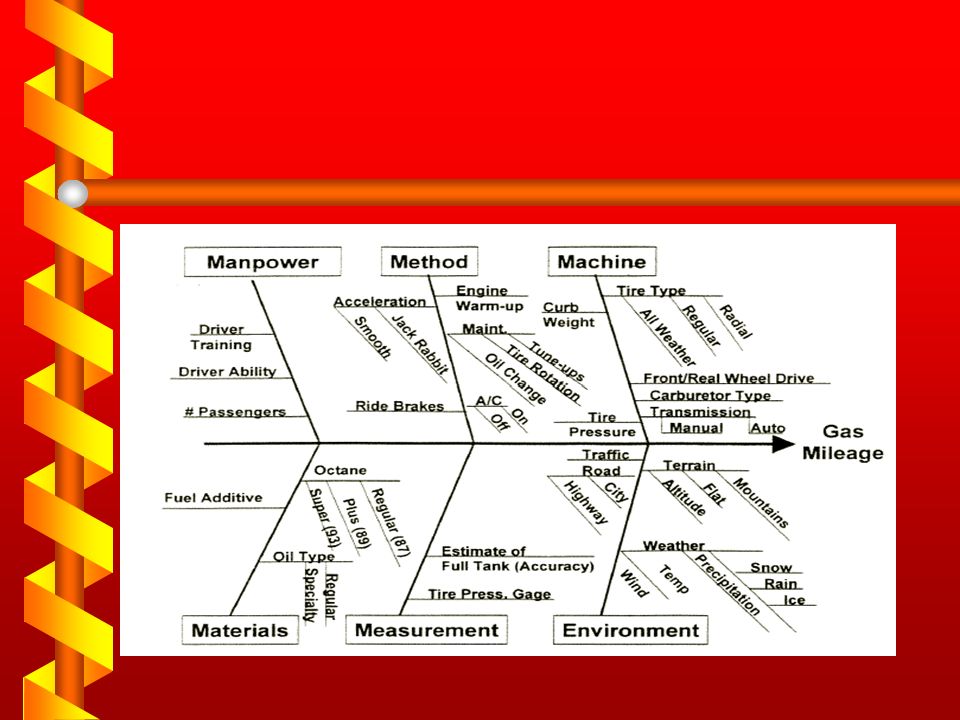
Fishbone Diagrams Each branch of the diagram represents a different category of causes Typical categories: –Materials –Machinery –Measurement –Methods –People –Environment However, can create other/different categories better suited to your specific problem.

27
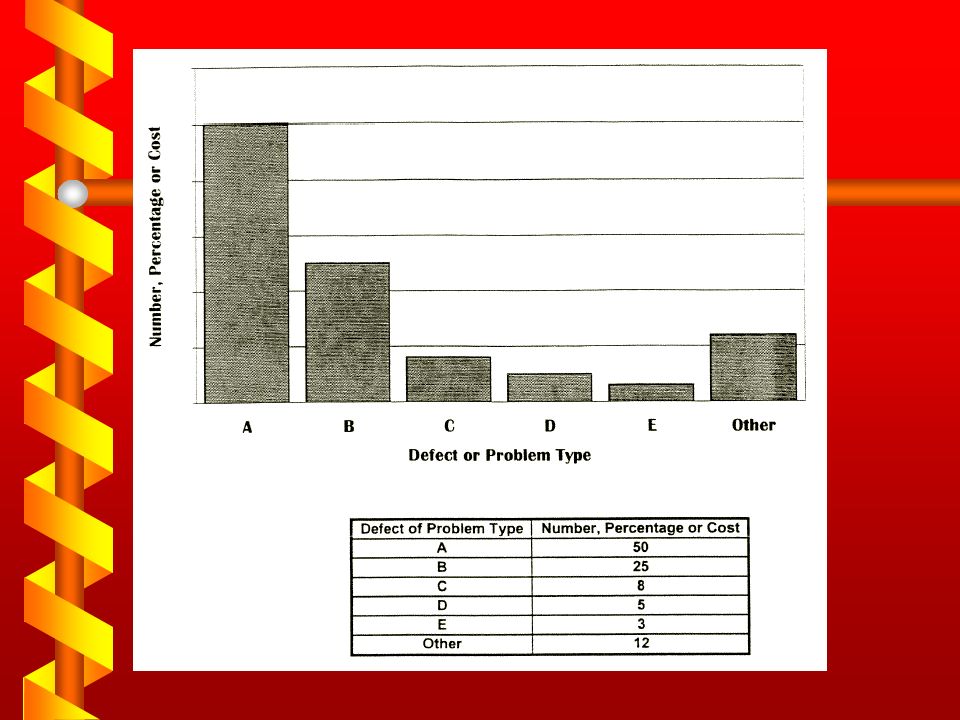
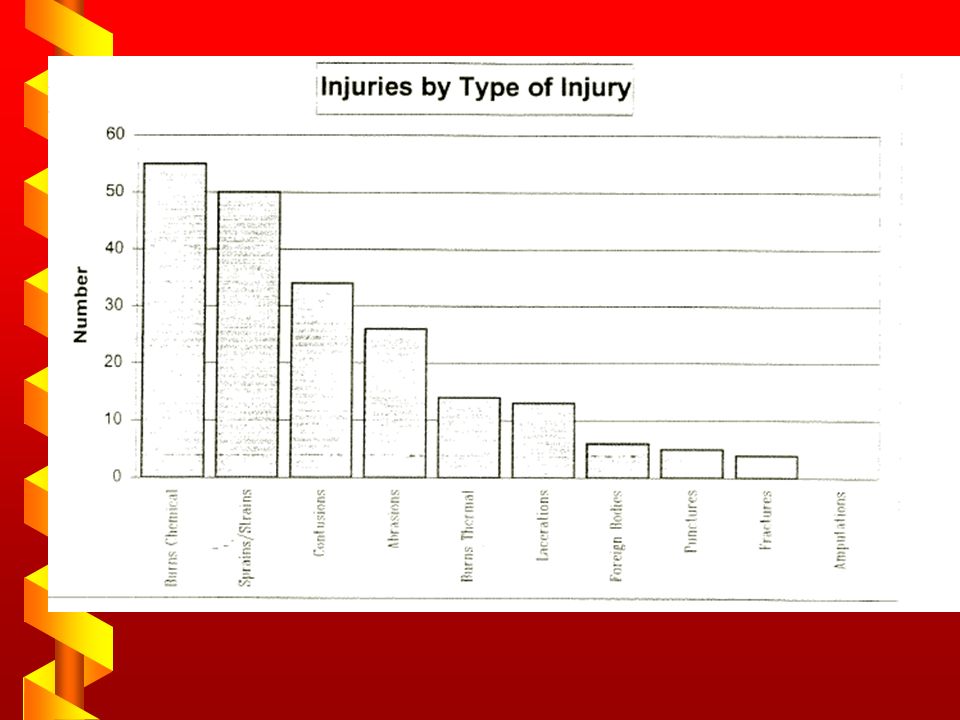
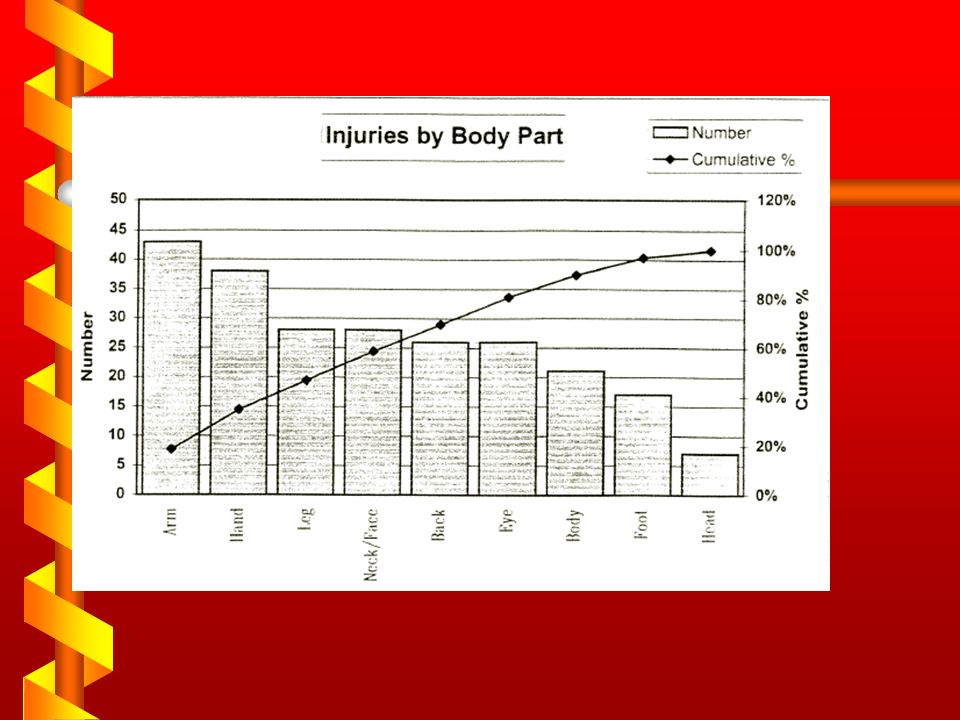
Pareto Chart Purpose: –Ranking problems from big to small Helps when: –Team needs to know which problems to address first. Demonstrates 80/20 rule –20% of the causes account for 80% of the problems Highlights the important elements (the “vital few”) and the insignificant ones (the “trivial many”)
 and the insignificant ones (the trivial many ).")
31
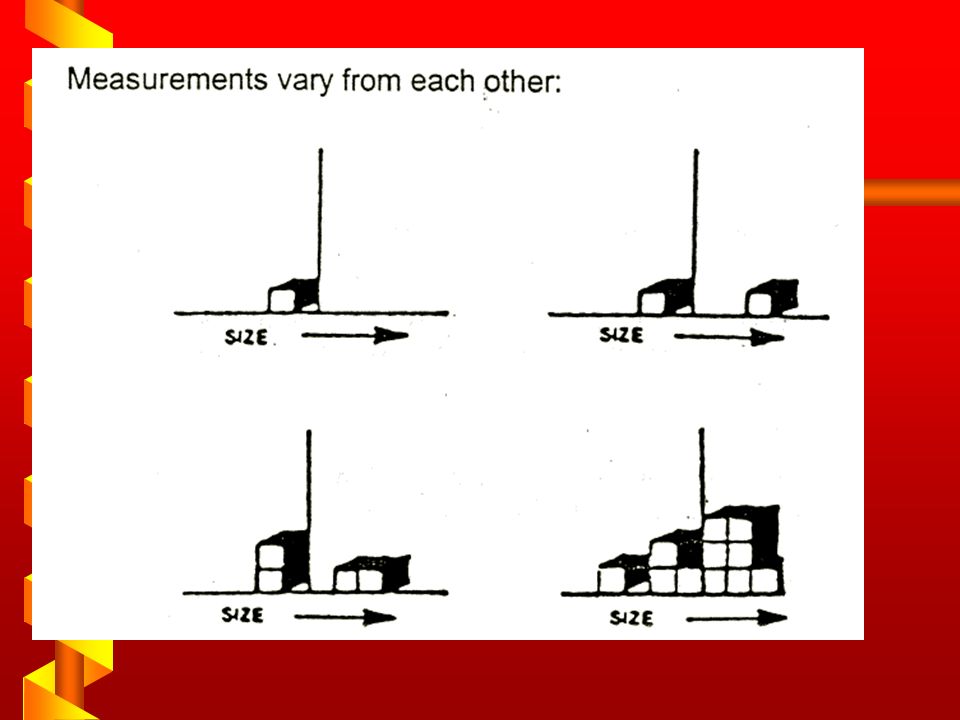
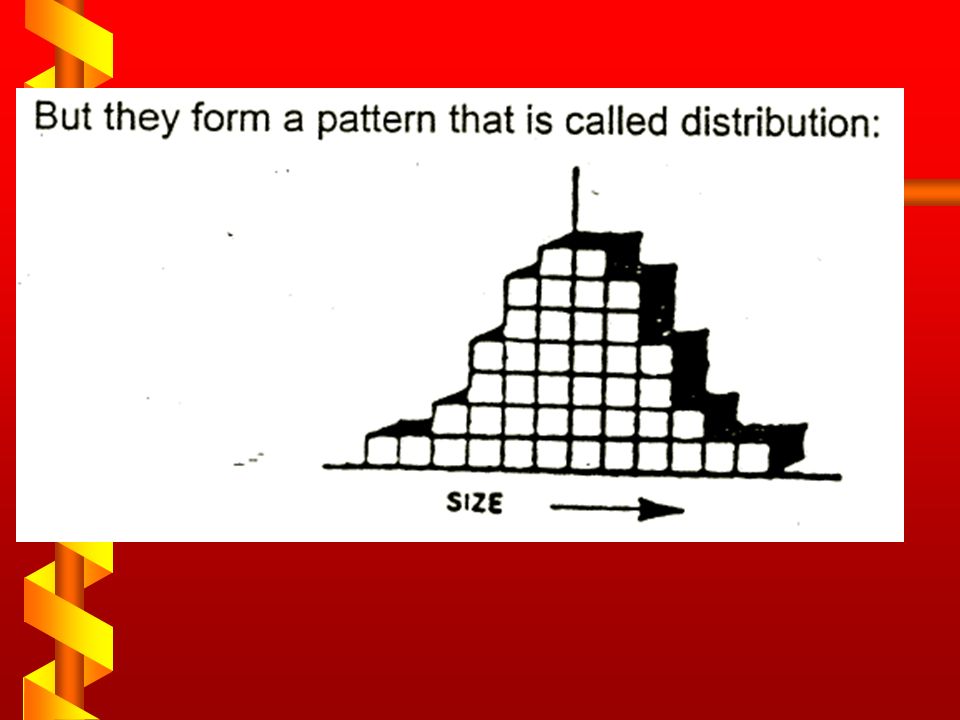
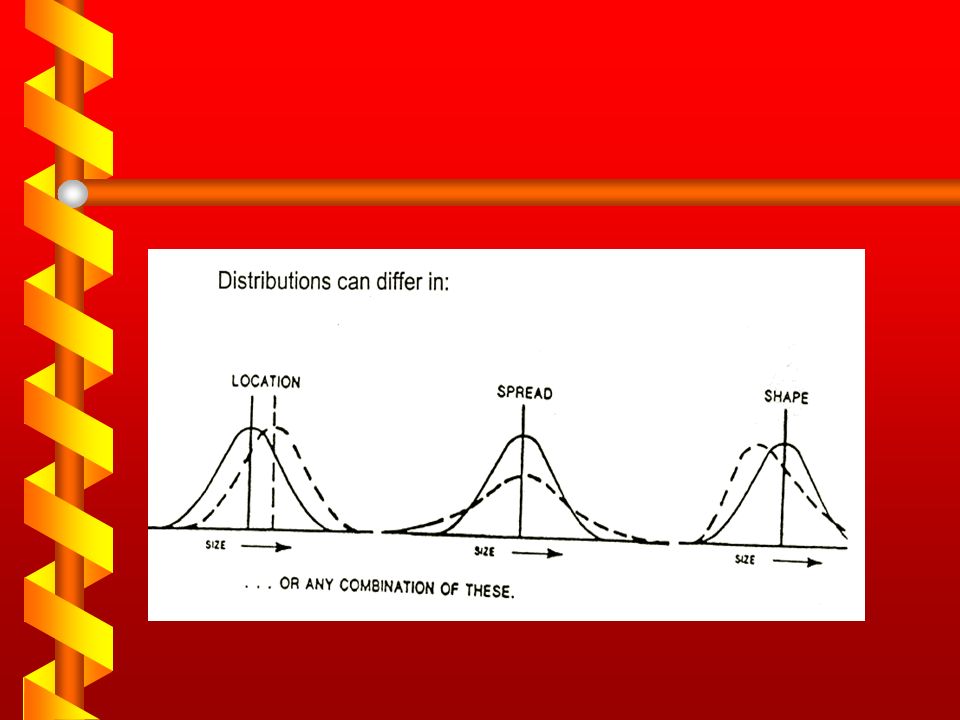
Histograms Purpose: –To indicate the distribution and variation of sample data Helps to: Determine if process is in statistical control – can indicate if “special causes” are causing control problems Histograms roughly approximate the normal distribution if everything is in control.

34
Distributions can be represented in several ways.

36
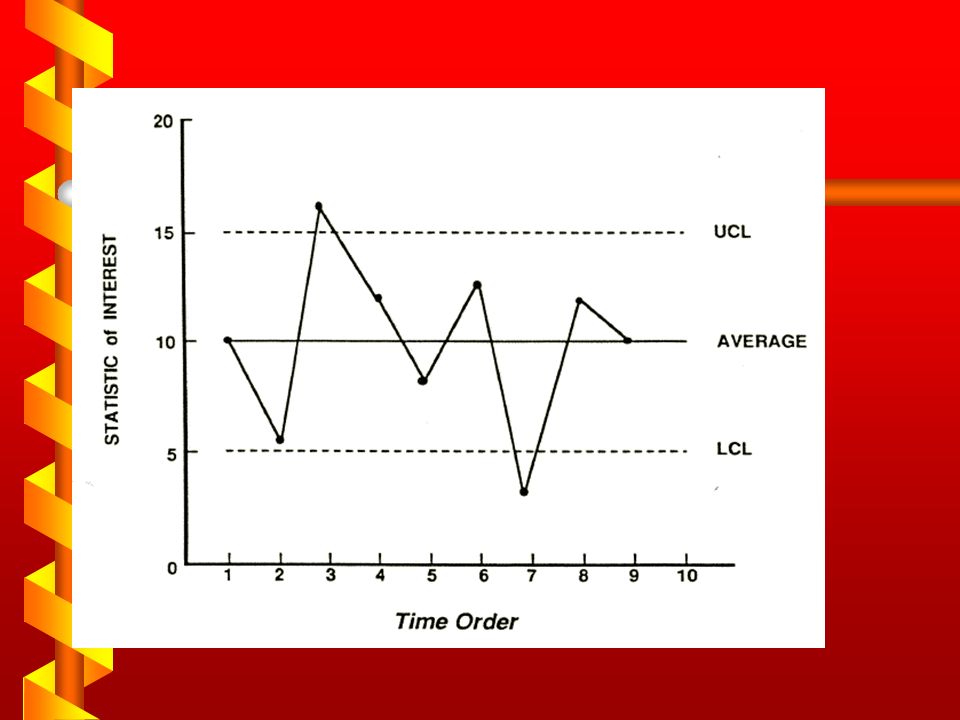
Control Charts A line graph that indicates: Samples vary from the process average If samples are in statistical control (w/in control limits) Purpose: –To track process variation Helps to: –Determine if process is in statistical control
 Purpose: –To track process variation Helps to: –Determine if process is in statistical control")
38
Control Charts

39
Six Sigma Relatively new quality management tool Developed in 1980’s based on Crosby’s concept of ZERO DEFECTS Aim is to reduce process variation so that there are no more than 3.4 defects per 1,000,000. (99.99966%)
.")
40
Six Sigma DMAIC – Define, Measure, Analyze, Improve, and Control. –Improvement system for existing processes that fall below specifications and will be improved incrementally

41
Six Sigma DMADV – Define, Measure, Analyze, Design, Verify –Improvement process system utilized to develop new processes or products at levels that meet Six Sigma from the beginning. –System can also be used for existing processes that require more than incremental improvement

42
Maintenance Programs Corrective – waiting for failure to occur, then fix Preventative – conduct regular maintenance to avoid failure Predictive – monitor condition of equipment and use data to identify possible failure and their prevention Detective – regular check of alarms, detectors

43
Maintenance and Quality Improvement Total Productive Maintenance (TPM) – Overall Equipment Effectiveness Predictive/Preventive Maintenance (PPM) Using Quality Control Tools Working as Self-Directed Teams
 – Overall Equipment Effectiveness Predictive/Preventive Maintenance (PPM) Using Quality Control Tools Working as Self-Directed Teams")
44
Process Control Tech & Quality Familiarize oneself with quality programs Practice quality habits Provide good customer service – internally and externally Gather data for SPC tools Follow documented procedures

45
Process Control Tech & Quality Monitor and control process operations Assist with maintenance tasks such as TPM or PPM Troubleshoot with goal of continuous improvement in mind Communicate effectively Keep quality records

46
Process Control Tech & Quality Participate in quality training sessions Work with quality teams to achieve goals Utilize skills in time management, organization, planning, prioritization, and attention to detail CONTINUALLY IMPROVE

47
Summary Quality is applied to all aspects of the process industry Everyone has a role and a responsibility in quality There are accepted methods and statistical tools in place to perform quality analyses

48
Student Activities Quality exercise (Voice of the Customer) Textbook questions: –CAPT Ch. 13, pages 218 – 219, questions 1 – 13, pages 219 – 220, activities 1 - 5 –Thomas Ch. 16, page 356, questions 1 - 10

Similar presentations

 –Continuous improvement tools Quality assurance.>")


