Download presentation
Presentation is loading. Please wait.

1
QCD Phase Diagram and Critical Point Lecture at 5 th CBM India Collaboration Meeting, BHU, Varanasi, India December 28, 2009 Reviews: C.P. Singh, Phys. Rep. 236,147(1993) Int. J. Mod Phys. A7, 7185 (1992)
 Int. J. Mod Phys. A7, 7185 (1992).")
2
Outlines : 1. Introduction 2. History of QCD Phase Transition. 3. QCD phase transition and Critical Point. 4. Summary.

3
What happens to a matter at extremely large temperature and/or density 1 Present Universe Atomic matter Nuclear matter Energy density Nucleons/ Compare (if = 0.8 fm)
")
4
QCD – Lagrangian density Confinement Asymptotic freedom Continued….

5
QCD Two Important features = 0.2 GeV/c (1) Confinement → Infra red slavery or (2) Asymptotic freedom QCD, the theory of strongly interacting matter, predicts that, above a critical energy density, hadrons, the constituents or normal nuclear matter, decompose into a plasma of quarks and gluons, the Quark Gluon Plasma, QGP. Such a state existed shortly after the Big Bang and may exist as well in the neutron stars. Colliding heavy ions at extreme energies is the only way to study QGP on Earth.

6
QCDQED Debye screened Debye screened confining confining Bound Bound state screened state screened r At large T and large ρ r D is small ( r D < r) and thus Hadrons→ melt down Hadrons→ QGP
 and thus Hadrons→ melt down Hadrons→ QGP")
7
P T Tri Critical point Ice Steam Critical Point Water Cross-over region Phase Diagram of H 2 O C2C2 C1C1 C 2 ( T C = 273.16 0 K, P C = 600 N / m 2 ) C 1 ( T C = 647 0 K, P C = 2.21x !0 7 N / m 2 ) Ist orderDiscontinuity in S, V II orderDiscontinuity in C P, K T
 C 1 ( T C = K, P C = 2.21x !0 7 N / m 2 ) Ist orderDiscontinuity in S, V II orderDiscontinuity in C P, K T")
8
QCD predicts a colour deconfining Phase transition QGP - Quarks and gluons are coloured matter. - Force increases with separation. - Large density matter. Hadrons - Hadrons are colour insulators. - Force decreases with separation. - Dilute and low density matter.

9
HISTORY OF QCD PHASE TRANSITION

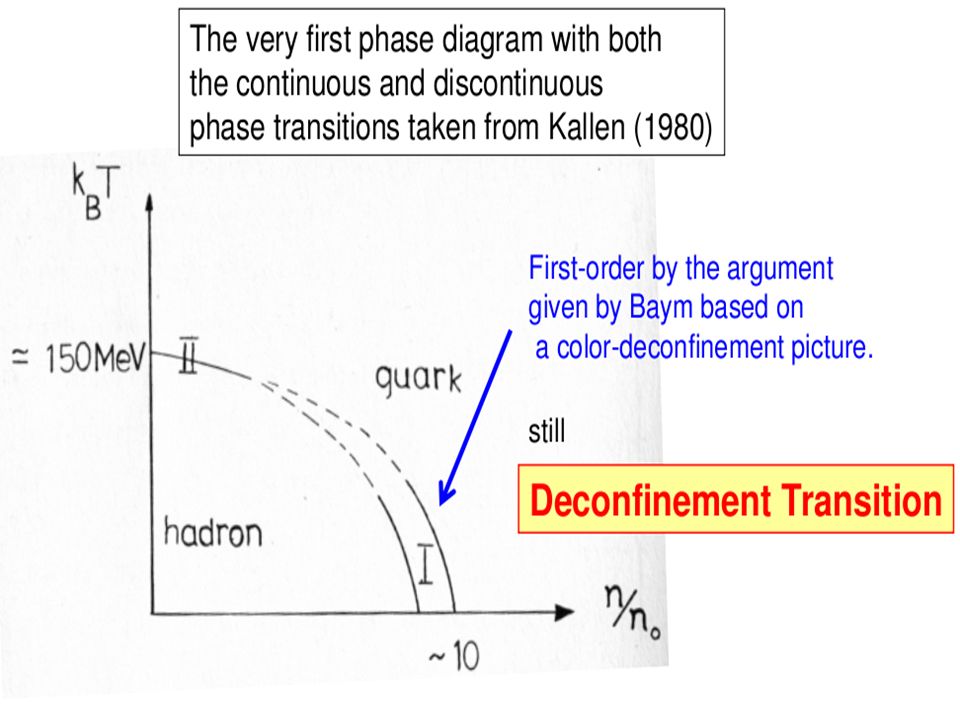
11
- Baym (1982)
")
12
Order of Phase transition F = Free energy of the system discontinuous then it is nth order phase discontinuous then it is nth order phase transition. transition. 1 st order = Latent Heat QGP QGP 1 st order 1 st order HG SYMMETRIC 2 nd order HG SYMMETRIC 2 nd order Broken symmetry Broken symmetry T

13
Phase transition between H.G. (Pion Gas) QGP 1st order phase transition Maxwell’s construction If P T -B -B
 QGP 1st order phase transition Maxwell’s construction If P T -B -B.")
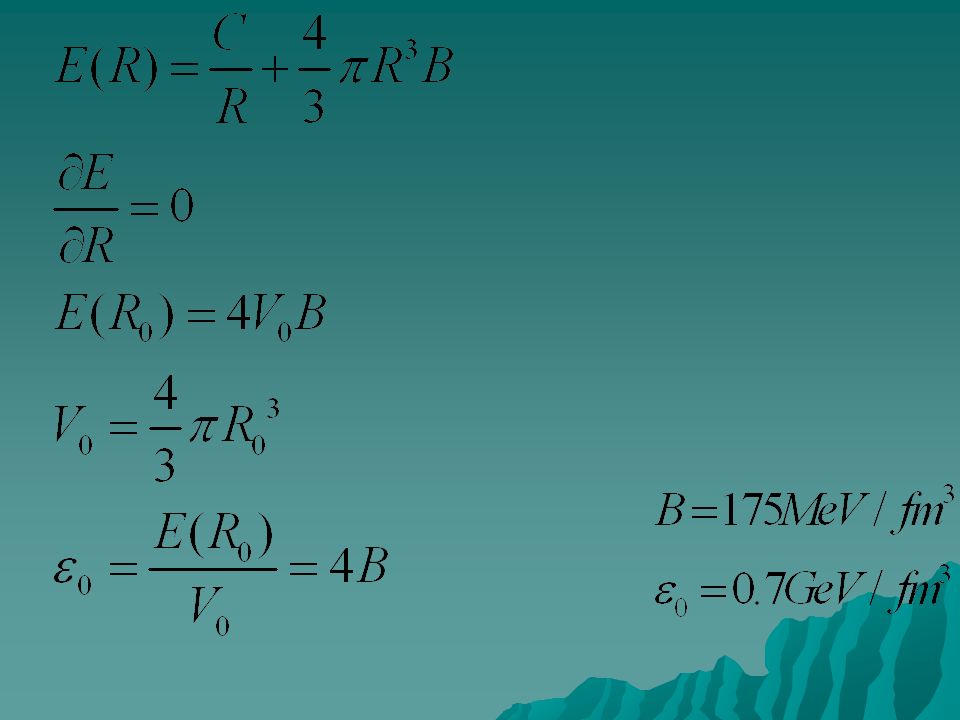
14
Perturbative QCD vacuum ( High T) Real or Physical QCD vacuum (Low T) Confinement pressure B Stress arising due to K.E. of quarks TWO QCD VACUA Bag Model: Perturbative QCD vacuum ( High T) Real or Physical QCD vacuum (Low T) Confinement pressure B Stress arising due to K.E. of quarks
 Real or Physical QCD vacuum (Low T) Confinement pressure B Stress arising due to K.E. of quarks.")
16
QGP in two situations Heat ---------------> dense in mesons T > 200 MeV Early Universe ( second after Big Bang) Baryons Mesons QGP in two situations Temperature T Measures the mean energy of the system. Baryon chemical potential measures the mean number of baryons in the system. Heat ---------------> dense in mesons T > 200 MeV Early Universe ( second after Big Bang) Baryons Mesons
 Baryons Mesons.")
17
Compress dense inBaryons ( Core of neutron star)
")
18
Chiral Symmetry Restoration Global flavour rotations matrix So rotation group is Chiral group 2 (2) (2) Flavour + rotations
 (2) Flavour + rotations")
19
Noether Current if 0 Chiral Symmetry Restoring Phase Transition This is non zero(250 MeV) 3
 3")
20
Helicity of the quark is fixed (gluon interaction does not change the helicity ). B L & B R both are good quantum numbers. Quark can exist in both the helicities. B= B L + B R is a good quantum number. chiral symmetry is broken ( left and right quarks are not Independent ). The vacuum contains pairs ≈ (250 MeV) 3 = Rate at which quarks flip their helicity.
. The vacuum contains pairs ≈ (250 MeV) 3 = Rate at which quarks flip their helicity..")
21
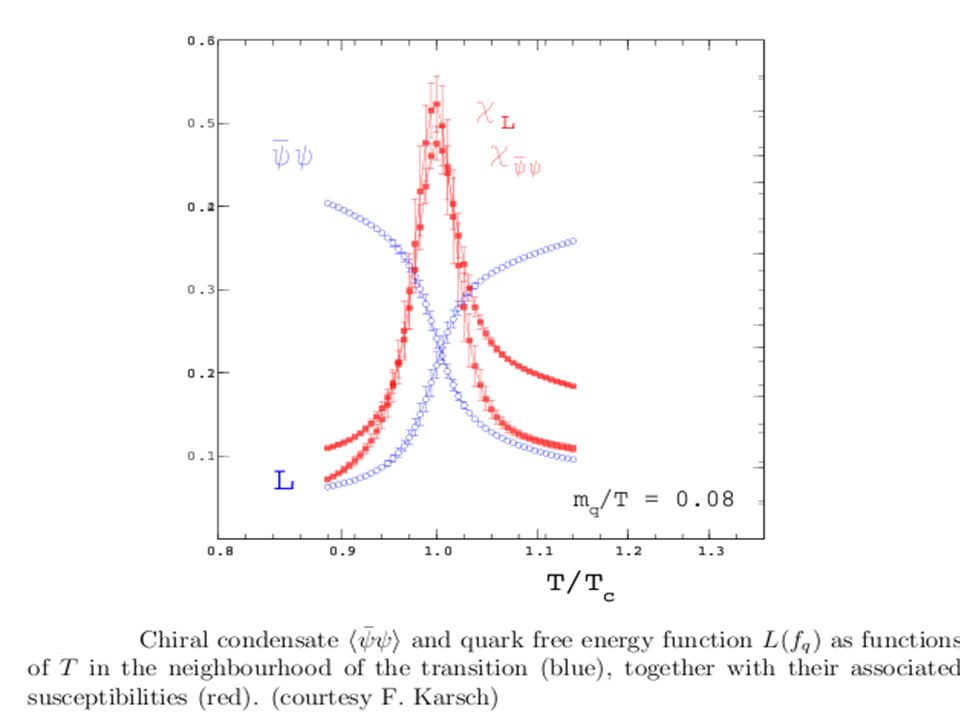
Order parameter => T > T C = large T < T C Confinement => T < T C = 1 T > T C Susceptibilities

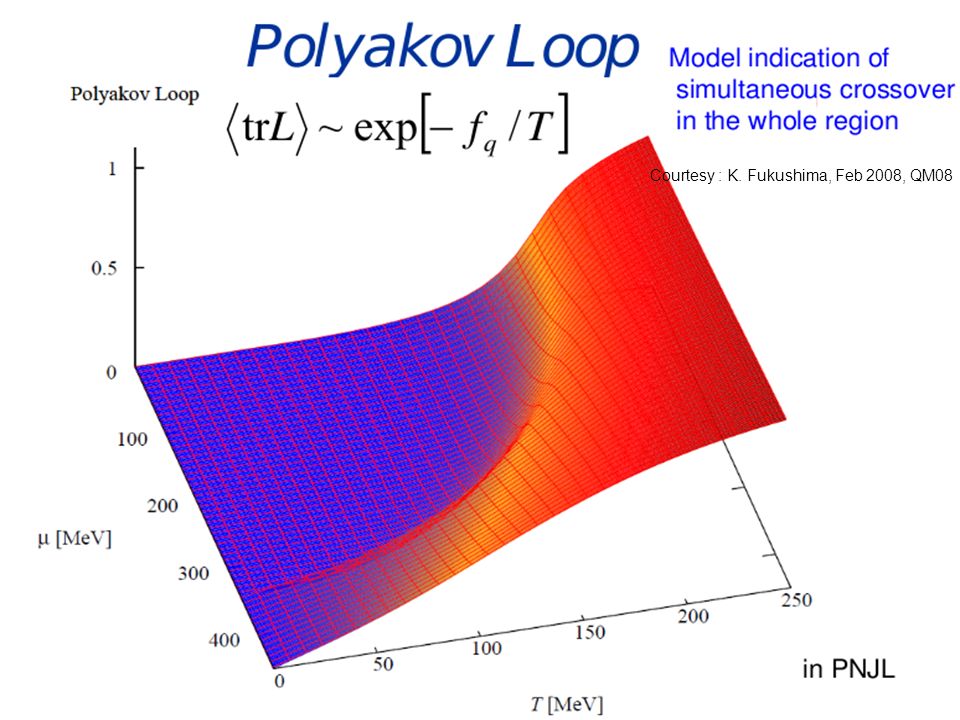
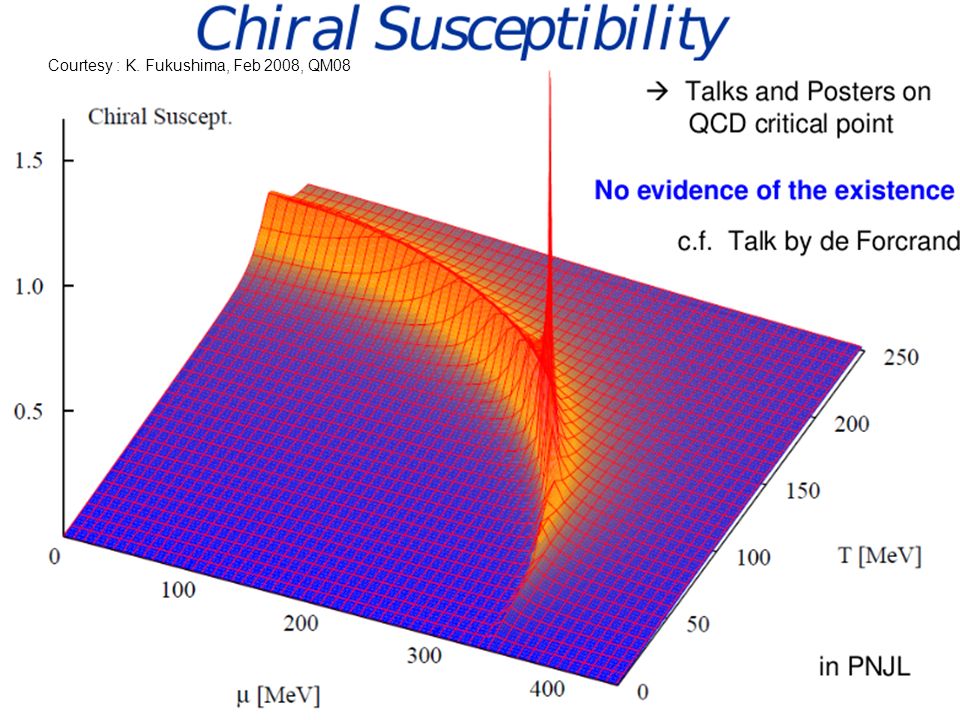
22
Courtesy : K. Fukushima, Feb 2008, QM08

25
LATTICE GAUGE THEORY - - A numerical simulation of finite temperature QCD. - - Entire range of strong interaction thermal dynamics. Main Features 1. 1. We make space-time discrete and lattice if points with finite spacing a 0 gives continuous limit. We have lattice of sites. and V = T = 1. 1. Divergences due to small (infra-red) and large (ultra- violet) momenta disappear. 2. 2. = plaquette = square in space-time grid
 and large (ultra- violet) momenta disappear = plaquette = square in space-time grid.")
26
matter fields as site variables = Link variable between adjacent sites Wilson Loop Order Parameter

27
Results: No quarks Only gluons : 1 st order 3 or 4 massless quarks : 1 st order 2 massless quarks Continuous 2 massless, non zero Continuous Now calculations started with on the lattice Action

30
QCD Phase Diagram Reference :QCD Phase Boundary and Critical Point in a Bag Model Calculation C. P. Singh, P. K. Srivastava, S. K. Tiwari, Physical Review D (Accepted) QGP Equation Of State - where Here we have used B 1/4 =216 MeV and Λ =100 MeV. Hadron Gas Equation Of State - The Grand canonical partition function using full statistics and including excluded volume correction in a thermodynamically consistent manner -
 QGP Equation Of State - where Here we have used B 1/4 =216 MeV and Λ =100 MeV. Hadron Gas Equation Of State - The Grand canonical partition function using full statistics and including excluded volume correction in a thermodynamically consistent manner -.")
31
Where g i is the degeneracy factor of ith species of baryon, E is the energy of the particle V 0 i is the eigen volume of one ith species of baryon and is the total volume occupied We can write above equation as - Where and Is the fugacity of the particle, n ex i is the number density of jth type of baryons after excluded volume correction.

32
Using the basic thermodynamical relation between number density and partition function We can write as - Where Is the fractional volume occupied. We can write R in an opera- -tor equation - Wherewith And the operator Using Neumann iteration method, we get - Solving this equation numerically, we can get the total pressure of hadron gas after Excluded volume correction is - To draw the Phase diagram we uses the Gibbs’ equilibrium condition of phase transition -

33
New and Interesting Features : (1)By Maxwell construction, it gives first order phase transition : P H (T c,µ C ) = P Q (T c,µ C ) (2) In cross over region, P Q > P H (3) End point of first order line is critical point (4) Our EOS for HG is thermodynamically consistent n B =∂P H / ∂µ B (5) Freeze out curve from HG description. (6) We have used full quantum statistics so we cover entire (T, µ B ) plane (7) We have used QGP EOS in which perturbative corrections have been added and non perturbative term includes Bag constant B 0
 We have used full quantum statistics so we cover entire (T, µ B ) plane (7) We have used QGP EOS in which perturbative corrections have been added and non perturbative term includes Bag constant B 0.")
34
Chemical Freeze out points : By fitting the hadron multiplicities at different energy √S NN (GeV) 2.73.323.844.324.846.312.317.3130200 T (MeV) 7087.198.1106.4113.6128.0150.4156163.3163.5 µ B (MeV) 760684630588.5548.7461.1278.420931.720.7
 T (MeV) µ B (MeV)")
35
Color Flavour Locked ( CFL) Phase : Fermi degenerate matter: so For quarks Neutron star densities At Fermi surface -> qq interaction is weakly attractive ( Single gluon exchange) Results into BCS pairing instability diquark condensate ≠ 0
 Phase : Fermi degenerate matter: so For quarks Neutron star densities At Fermi surface -> qq interaction is weakly attractive ( Single gluon exchange) Results into BCS pairing instability diquark condensate ≠ 0")
36
2 Δ = energy gap between highest occupied and lowest vacant one particle state Analogous to BCS cooper pair condensate in Superconductor 2 Δ EFEF E k K. Rajagopal Δ 10 -100 MeV a, b = 1,2 α, β =1,..3 Not colour neutral ≠ 0 Colour Superconductivity no true phase transition between SC and QGP If Color Flavour Locked phase Gluon mass ~ Δ Superfluidity Chiral Symmetry is broken, B is not a good Q. No.

38
Critical point predicted by our new model

39
Chemical freeze out points Critical point by Our new Model LTE04 LR04LTE03 LR01 NJL/inst NJL NJL/I NJL/II Critical point by different Lattice Model Critical point by different NJL Models

40
New Findings : (1)We show the presence of cross-over region and precise location of critical point T C = 160 MeV, µ C = 156 MeV (2) Entire conjectured phase boundary has been reproduced (3) We get a first order deconfining phase transition (4) Chemical Freeze out curve lies in close proximity to the critical point
We show the presence of cross-over region and precise location of critical point T C = 160 MeV, µ C = 156 MeV (2) Entire conjectured phase boundary has been reproduced (3) We get a first order deconfining phase transition (4) Chemical Freeze out curve lies in close proximity to the critical point")
41
Steps in space –time picture of nucleus-nucleus collisions: Pre equilibrium stage At (z,t) =(0,0), nuclei collides and pass through each other, nucleons interact with each other. Formation stage Quarks and gluons (qq,gg) are produced in the central region a large amount of energy is deposited. Equlibration Due to parton interaction plasma evolves from formation stage to a thermalized QGP. Hadronization Thermalized plasma expands and cools until hadronization takes place and mesons and baryons are created. Freeze-out When temperature falls further, the hadrons no longer interact and they stream out of the collision region towards the detectors. towards the detectors.
 are produced in the central region a large amount of energy is deposited. Equlibration Due to parton interaction plasma evolves from formation stage to a thermalized QGP. Hadronization Thermalized plasma expands and cools until hadronization takes place and mesons and baryons are created. Freeze-out When temperature falls further, the hadrons no longer interact and they stream out of the collision region towards the detectors. towards the detectors..")
42
Signatures of QGP: 1. HG Hot,dense hadron gas ( Background) QGP Quark Gluon matter with a collective QGP Quark Gluon matter with a collective behaviour. behaviour. How to eliminate background contributions. How to eliminate background contributions. 1. Lack of proper understanding of ultra relativistic Nuclear collisions: a. Thermal statistical model a. Thermal statistical model b. Superposition of hadron-hadron scattering. b. Superposition of hadron-hadron scattering. c. Transport theory Non equilibrium. c. Transport theory Non equilibrium.
 QGP Quark Gluon matter with a collective QGP Quark Gluon matter with a collective behaviour. behaviour. How to eliminate background contributions. How to eliminate background contributions. 1. Lack of proper understanding of ultra relativistic Nuclear collisions: a. Thermal statistical model a. Thermal statistical model b. Superposition of hadron-hadron scattering. b. Superposition of hadron-hadron scattering. c. Transport theory Non equilibrium. c. Transport theory Non equilibrium..")
43
Signals of QGP 1. 1. Dilepton production Thermometers Production rates and momentum distribution of these particles depend on the momentum distribution of the quarks and antiquarks in the plasma. Background contributions are Drell-Yann processes. Effects Mass and widths of resonances can shift in QGP ( e.g., etc) 2. J/ suppression J/ is produced in pre equilibrium stage. c and c cannot be thermally produced in QGP. J/ while passing through the deconfining QGP medium, dissociates into c c pair which separate from each other and there is less probability that they can combine with each other to form J/ after QGP. A-A collisions J/ QGP J/ formation less likely Pre-equilibrium cc separates A-A J/ HG J/ less in number absorption or Rescattering
 2. J/ suppression J/ is produced in pre equilibrium stage. c and c cannot be thermally produced in QGP. J/ while passing through the deconfining QGP medium, dissociates into c c pair which separate from each other and there is less probability that they can combine with each other to form J/ after QGP. A-A collisions J/ QGP J/ formation less likely Pre-equilibrium cc separates A-A J/ HG J/ less in number absorption or Rescattering.")
44
3.Strangeness enhancement For Baryon dense matter For Baryon dense matter 300 MeV 300 MeV 150 MeV 150 MeV

45
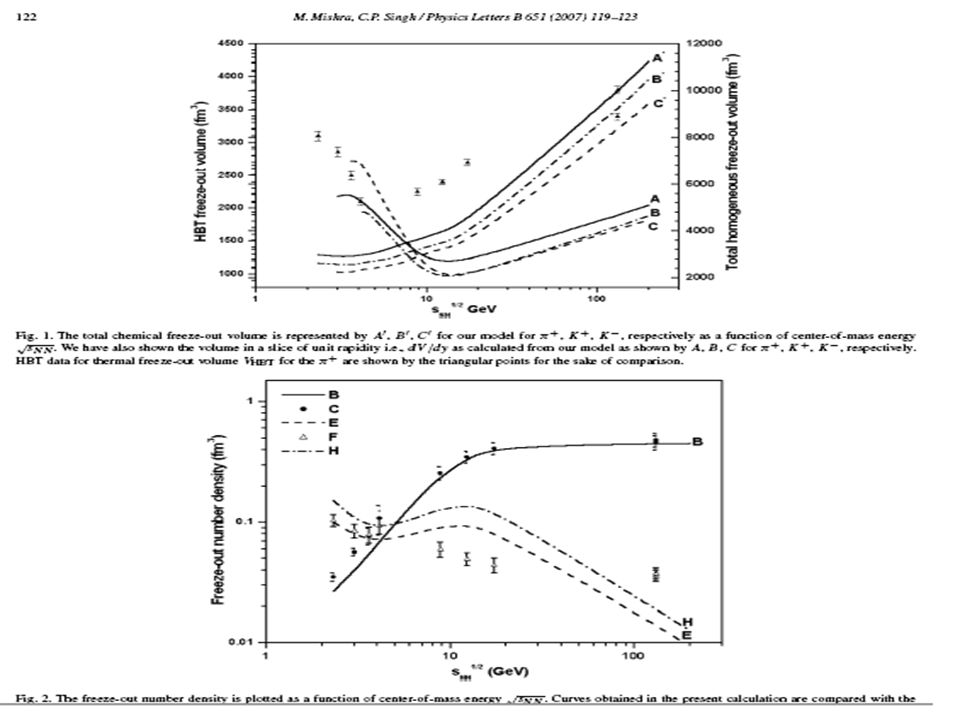
Reference : M. Mishra and C. P. Singh Phys. Rev. C 78, 024910 (2008)
")
46
a) Baryon free QGP T >> = T >> = a) Lower threshold ss 300 MeV (QGP) ss 300 MeV (QGP) KK 1000 MeV (HG) KK 1000 MeV (HG) d) gg ss facilitates strangeness in QGP After hadronization of QGP, ratio of particles like etc is large. 4. Jet Quenching In p p collisions, back to back two jets are produced. But when jet pass through the dense quark medium, one jet is more quenched and this effect is seen at RHIC.

47
5. HBT Interferometry: When all the interactions are stopped, still Bose Einstein attraction or Fermi Dirac repulsion between a pair of particles always exist. When all the interactions are stopped, still Bose Einstein attraction or Fermi Dirac repulsion between a pair of particles always exist. Interference in Interference in coincident detectors coincident detectors Correlation C(, ) = Correlation C(, ) = = Fourier transform of = Fourier transform of freeze-out density freeze-out density = Large radii large volume at thermal freeze-out Signals of 1 st order phase transition Signals of 1 st order phase transition
 = Correlation C(, ) = = Fourier transform of = Fourier transform of freeze-out density freeze-out density = Large radii large volume at thermal freeze-out Signals of 1 st order phase transition Signals of 1 st order phase transition.")
49
Experimental Status 1987-1999: Brookhaven National Lab : AGS Si, Au beams were accelerated to 14.6 GeV/A accelerated to 14.6 GeV/A CERN SPS S and Pb beams upto 200 GeV/A Inference Colliding nuclei are stopped Fireball Large number of produced particles which Large number of produced particles which cannot be obtained by simple superposition of cannot be obtained by simple superposition of p-p collisions. p-p collisions. 2000: BNL RHIC Collider Experiments (Au-Au at 200 GeV/A)
.")
50
SUMMARY - JET QUENCHING has been observed. - J/ suppression. - Large enhancement of strangeness. - HBT a large freezeout volume. - A perfect liquid with zero viscosity.

Similar presentations


 Resonance Production in Au+Au and Cu+Cu Collisions at s NN = 200 GeV & 62.4 GeV Motivation Analysis and Results Summary 1 Sadhana Dash Institute.>")


 >")


