Download presentation
Presentation is loading. Please wait.

1
Lecture 2: Biology Review II
Date: 8/29/02 Overview/Review of: Mapping Molecular techniques Markers

2
Genetic Mapping Definition: A genetic map is an ordering of genes and markers in a linear arrangement corresponding to their physical order along the chromosome. Based on linkage. Definition: A physical map is an ordering of landmarks on DNA, regardless of inheritance. Measured in base pairs. We will be discussing maps today. It follows the introduction to DNA discussed last time and motivates some of the techniques we’ll develop later.

3
Marker Definition: A marker is a gene or piece of DNA with easily identified phenotype such that cells or individuals with different alleles are distinguishable. e.g. a gene with known function e.g. a single nucleotide change in DNA Genetic maps use landmarks….these are markers.

4
Polymorphism Definition: A polymorphism is a detectable and heritable variation at a locus. Definition: A marker is polymorphic if the most abundant allele comprises less than X% of all alleles, usually 95%. Definition: A mapping population is a population used to map genes. One important property of markers, for them to be of use. Mapping populations can be natural or controlled. Questions of interest: Which parents? Which mating scheme? Which markers? In natural populations, which individuals to study?

5
Natural Populations Definition: Natural populations are those where mating is not controlled by the experimenter, though the experimenter can choose who to observe. Only phenotype observable, genotype sometimes unknown, phase is unknown. Knowns: allele frequencies, genotype frequencies, amount of disequilibrium. Linkage Disequilibrium: when the frequency of certain combinations of alleles at different loci varies from that expected if they were not linked.

6
Hardy-Weinberg Equilibrium I
Refers to the equilibrium achieved at a single locus. Hardy-Weinberg Equilibrium (HWE) is achieved when the allele frequencies and genotype frequencies do not change from generation to generation.
 is achieved when the allele frequencies and genotype frequencies do not change from generation to generation.")
7
Hardy-Weinberg Equilibrium II
Let pA and pB be the frequencies of allele A and B in the population. Let pAA be the frequency of genotype AA. Similarly, pAB and pBB are genotype frequencies. Then HWE implies that pAA = pA2 pAB = 2pApB pBB = pB2 HWE implies a relationship between the allele and genotype frequencies.

8
Measures of Polymorphism
P(heterozygote) = Definition: Polymorphism Information Content (PIC) The third term is the probability that we score the result of an uninformative mating.
 = Definition: Polymorphism Information Content (PIC) The third term is the probability that we score the result of an uninformative mating.")
9
Uninformative Matings
AB X AB uninformative informative ½ are informative ASK QUESTION Probability that you know which alleles were transmitted. 1 AA : 2 AB : 1 BB

10
Classical Linkage Analysis
A few markers. Must have detectable variation. Must be substantially variable in study population. Controlled crosses: testcross, backcross, double- haploid Well-defined parental lines.

11
Three-Point Testcross Design
dominant recessive testcross X X F1 F2 backcross: ignore recombination in the homozygous parent A S Y A S Y b t z b t z A S Y b t z b t z b t z b t z b S z X X

12
Three-Point Testcross Results
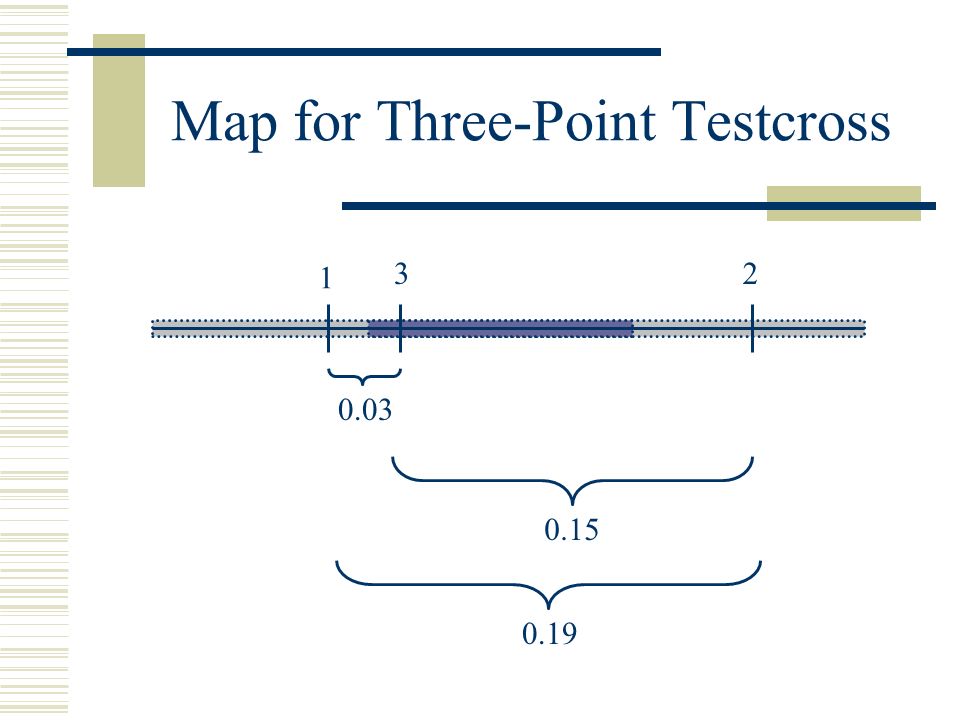
Count the number of recombinant haplotypes produced by F1 parent. Calculate the recombinant fraction for each pair of genes. 1 2 3 -- 0.19 0.03 0.15 For each offspring you have observed one opportunity for recombination. Actually two, but one is undetectable in homozygous parent.

13
Map for Three-Point Testcross
1 3 2 0.03 0.15 0.19
14
Backcross Design new recombinant self self F2 no more changes
Skip the repeated selfing in double-haploid design. F2 no more changes

15
Large-Scale Mapping Many genetic markers Steps of analysis:
pairwise linkage analysis group into linkage groups order markers in each linkage group

16
Comparative Mapping Compare maps of different species.
Due to similarities, information can be transferred between species. Information about how genomes evolve. Uses conserved loci rather than highly variable loci.

17
Molecular Techniques: probes
5’ – …AAGCCTAGAGCCCTTAGCCAAAAG… – 3’ 3’ – …TTCGGATCTCGGGAATCGGTTTTC… – 5’ denature add probe 3’ – *ATCTCGGGAATC – 5’ hybridization 5’ – …AAGCCTAGAGCCCTTAGCCAAAAG… – 3’ *ATCTCGGGAATC

18
Molecular Techniques: restriction enzymes
Definition: An endonuclease is an enzyme (protein that acts as a catalyst to speed up the rate of a biochemical reaction) that cleaves nucleic acid strands at internal sites (phosphodiester bond). Definition: A restriction endonuclease is an enzyme that cuts DNA at specific sites that it recognizes. EcoRI ’ GAATTC 3’ 3’ CTTAAG 5’ Often the recognizes sites are palindromic. N is the length of the genome and b is the restriction site length. number of cut sites = N/4b
 that. cleaves nucleic acid strands at internal sites (phosphodiester. bond). Definition: A restriction endonuclease is an enzyme that cuts. DNA at specific sites that it recognizes. EcoRI 5’ GAATTC 3’ 3’ CTTAAG 5’ Often the recognizes sites are palindromic. N is the length of the genome and b is the restriction site length. number of cut. sites = N/4b.")
19
Molecular Techniques: gel electrophoresis
DNA is negatively charged. Proteins can also be charged. An electric current is passed through a porous medium (agarose, acrylamide) and molecules in the medium respond by moving in electric field, but at different rates based on size and charge. agarose is more porous than acrylamide
 and molecules in the medium respond by moving in electric field, but at different rates based on size and charge. agarose is more porous than acrylamide.")
20
Electrophoretic Gel

21
Molecular Technique: PCR I
5’ 5’ Denaturation and hybridization 5’ 5’ Elongation & denaturation 5’ 5’

22
Molecular Technique: PCR II

23
Physical Maps Banding patterns on chromosomes In-situ hybridization
Denature metaphase chromosomes Add radioactive or fluorescent probe Visualize chromosomes DNA fragmentation DNA sequence: still not practical for all organisms Banding patterns have low variation, so not so good as marker. Need to repeat several times to get accurate localizations for FISH. For some organisms get 1MB (1 million nucleotides) resolution at this level.
 resolution at this level.")
24
DNA Fragmentation Larger fragments better (rare cutters; partial digestion) Find overlap by sequencing or hybridization.
 Find overlap by sequencing or hybridization.")
25
DNA Vector I Definition: A cloning vector is a DNA molecule that is capable of self-replicating. Insert the fragment of foreign DNA to make recombinant DNA.

26
DNA Vector II phage: virus that infects bacteria (5-25 kb).
cosmid: Packaged in lambda phage and infects E. coli (35-45 kb). yeast artificial chromosome (YAC): has telemere, centromere, and replication origin ( kb). bacterial artificial chromosome (BAC) plasmid: extrachromosomal circular DNA nonessential for cell survival.
. yeast artificial chromosome (YAC): has telemere, centromere, and replication origin ( kb). bacterial artificial chromosome (BAC) plasmid: extrachromosomal circular DNA nonessential for cell survival.")
27
How Many Clones? Let N be the number of clones made.
Let NS be the number of nonoverlapping clones needed to cover the full genome. For instance, the number of YACs (700 kb) to cover genome with 95% probability is 12,838 More: M. S. Waterman Introduction to Computational Biology: Maps, Sequences, and Genomes
 to cover genome with 95% probability is 12,838. More: M. S. Waterman. Introduction to Computational Biology: Maps, Sequences, and Genomes.")
28
Genetic Mapping Still Needed
Even if the full sequence is known, mapping is still necessary. There must be some way to correlate a trait/phenotype with something on the sequence.

29
Physical Mapping Still Needed
Linkage maps lack resolution Sample more people Better statistics Let recombination accumulate over many generations. Even with most precise linkage map can identify a gene to 1 cM (1 Mb in humans).
.")
30
Morphological Markers
Differences in shape, color, size, etc. Must have one-to-one correspondence with a controlling gene.

31
Protein Markers Definition: An isozyme are proteins with same enzymatic function but different structural, chemical, or immunological characteristics. Differences: amino acid composition, size, modifications (e.g. phosphorylation). Differences visualized: gel electrophoresis, mass spectrometry, etc. Some modifications are not heritable, vary with developmental stage, etc.
. Differences visualized: gel electrophoresis, mass spectrometry, etc. Some modifications are not heritable, vary with developmental stage, etc.")
32
DNA Marker: RFLP I Definition: RFLP is Restriction Fragment Length Polymorphism. DNA digested with endonuclease. Separate fragments by electrophoresis. Denature strands. Transfer single-stranded DNA to durable membrane and immobilize (Southern blot). Hybridize labeled probe to the blot. Visualize probe. DNA is smear in gel, but probe isolates only a few. Northern blot when RNA is the target. Why are northern blots not often used for markers.
. Hybridize labeled probe to the blot. Visualize probe. DNA is smear in gel, but probe isolates only a few. Northern blot when RNA is the target. Why are northern blots not often used for markers.")
33
DNA Marker: RFLP II DNA polymorphisms that RFLP identifies:
mutation in the restriction site mutation elsewhere to create restriction site insertion/deletion of DNA RFLP markers are codominant

34
Mini- and Micro-Satellite Markers
Definition: minisatellites or VNTR (Variable Number of Tandem Repeats) are tandem repeates of sequences bp long. Detected by hybridization or PCR. Definition: microsatellites or SSR (Simple Sequence Repeat) are direct tandem repeated sequences of DNA of 1-6 bp. Usually less than 1000 repeats.
 are tandem repeates of sequences bp long. Detected by hybridization or PCR. Definition: microsatellites or SSR (Simple Sequence Repeat) are direct tandem repeated sequences of DNA of 1-6 bp. Usually less than 1000 repeats.")
35
STS and EST Definition: Sequence tagged sites (STS) is a short unique fragment of DNA. Definition: Expressed sequence tags (EST) are subsets of STSs from cDNA clones. Represent transcribed genes (e.g. usually proteins). STS: about 300 bp cDNA clones are clones made from mRNA (transcribed DNA).
 are subsets of STSs from cDNA clones. Represent transcribed genes (e.g. usually proteins). STS: about 300 bp. cDNA clones are clones made from mRNA (transcribed DNA).")
36
Single-Strand Conformational Polymorphism (SSCP)
Detects changes as small as 1 nucleotide in more than 1000 bp. Single-stranded DNA is electrophoresed on gel and migrates based on size and shape. Visualized by Southern blot with specific fragment probe or PCR specific fragment and visualize directly.

37
Random Amplified Polymorphic DNA (RAPD)
PCR with short probes that bind randomly to sites in the genome. Good for genomes where little sequence information is available. Band-present is dominant. Expected number of products = 2fN/16b f = max. length of PCR amplifiable fragment N is genome size b is number of nucleotides in primer.

38
Amplified Fragment Length Polymorphism (AFLP)
Cut DNA with frequent- and rare-cutting endonuclease Anneal adapters to the ends of the frequent-cutter cut sites. Amplify off adapters with PCR. Use various specific primers to amplify subsets of total. Visualize on denaturing polyacrylamide gel. Usually scored as dominant markers, but sometimes can be scored codominant (various intensities of bands or length variation).
.")
39
Choosing Markers High polymorphism. Clear interpretation.
Quick typing and easy automation. Personal preference.

Similar presentations


>")


 Size rangeExample speciesEx. Size BACTERIA1-10 Mb E. coli: 4.639 Mb FUNGI10-40 Mb S. cerevisiae 13 Mb INSECTS.>")


 in isolation. –Exactly what.>")

