Download presentation
Presentation is loading. Please wait.

1
Goal: Demand Summary Day Warm-up: Demand Worksheet

2
Collect Demand curves/schedules Quiz on demand on Friday Wednesday – mini project

3
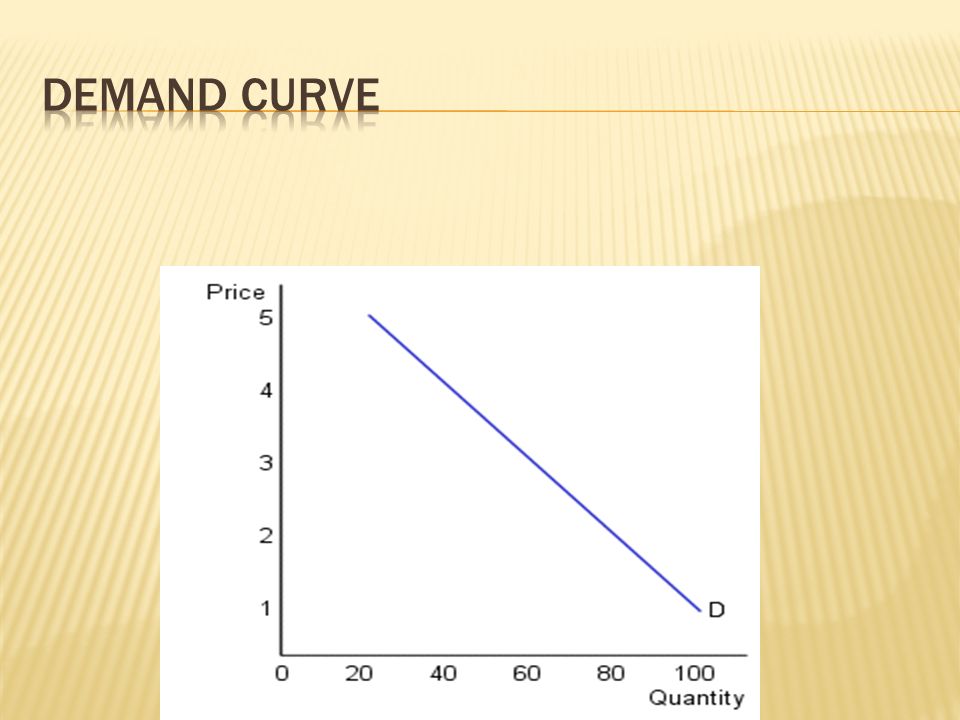
Definition – The ability and willingness of people to buy specific quantities of a good or service at alternative prices in a given time period The price paid is a willing choice based upon perceived value to the buyer The objective of the buyer is to get as much value as he can for the price paid The Law of Demand states that generally people will buy more of a good or service at lower prices and less at higher prices Demand Curves generally slope downward to the right

4
An inverse relationship exists between the price of a good and the quantity demanded in a given time period. Reasons: substitution effect income effect

7
Change in quantity demanded Change in demand

8
Table 1 Price QD $500 1,000 450 3,000 400 7,000 350 12,000 300 19,000 250 30,000 200 45,000 150 57,000 100 67,000 3-16 Copyright 2002 by The McGraw-Hill Companies, Inc. All rights reserved. Table 1 is the Demand Schedule Figure 1 is the Graph of the Demand Schedule Figure 1 The line is the Demand Curve

9
Table 1 Price QD $500 1,000 450 3,000 400 7,000 350 12,000 300 19,000 250 30,000 200 45,000 150 57,000 100 67,000 3-5 Copyright 2002 by The McGraw-Hill Companies, Inc. All rights reserved.

10
Table 1 Price QD $500 1,000 450 3,000 400 7,000 350 12,000 300 19,000 250 30,000 200 45,000 150 57,000 100 67,000 3-7 Copyright 2002 by The McGraw-Hill Companies, Inc. All rights reserved.

11
Table 1 Price QD $500 1,000 450 3,000 400 7,000 350 12,000 300 19,000 250 30,000 200 45,000 150 57,000 100 67,000 3-9 Copyright 2002 by The McGraw-Hill Companies, Inc. All rights reserved.

12
Table 1 Price QD $500 1,000 450 3,000 400 7,000 350 12,000 300 19,000 250 30,000 200 45,000 150 57,000 100 67,000 3-11 Copyright 2002 by The McGraw-Hill Companies, Inc. All rights reserved.

13
Table 1 Price QD $500 1,000 450 3,000 400 7,000 350 12,000 300 19,000 250 30,000 200 45,000 150 57,000 100 67,000 3-17 Copyright 2002 by The McGraw-Hill Companies, Inc. All rights reserved. Figure 1 Price and Quantity Demanded are inversely related Quantity Demanded is a point on the Demand Curve

14
Tastes and Preferences – The consumer’s desire for various goods and services Income – The higher it is, the more we consume Other Goods – Availability and Price Expectations – for income; for price changes; for new products; etc Number of Buyers – The more; bigger demand; greater demand

15
Effect of fads:

16
An increase in the number of buyers results in an increase in demand.

17
A higher expected future price will increase current demand. A lower expected future price will decrease current demand. A higher expected future income will increase the demand for all normal goods. A lower expected future income will reduce the demand for all normal goods.

18
Complement Products are two or more products that are generally consumed, or used, together Hot dogs and Mustard Peanut Butter and Jelly If price of the primary good, say hot dogs, increases, the quantity demanded (Qd) of that good will decrease, and A decrease in the Qd for hot dogs will reduce the demand for mustard, and ultimately the price of mustard will fall So, the prices of complementary goods are said to be inversely related
 of that good will decrease, and A decrease in the Qd for hot dogs will reduce the demand for mustard, and ultimately the price of mustard will fall So, the prices of complementary goods are said to be inversely related")
19
Substitute Products are two or more products where one product may be substituted for another Pepsi Cola or Coca Cola Canned tuna fish or canned chicken If the price of Pepsi increases, the quantity demanded (Qd) will decline, and The decrease in (Qd) for Pepsi will lead to an increase in the demand for Coca Cola which will lead to an increase in the price of Coca Cola, So the prices of substitute products are said to be directly related
 will decline, and The decrease in (Qd) for Pepsi will lead to an increase in the demand for Coca Cola which will lead to an increase in the price of Coca Cola, So the prices of substitute products are said to be directly related")
20
Price of coffee rises:

21
INELASTIC – CHANGE IN PRICE = NO CHANGE IN DEMAND ELASTIC – CHANGE IN PRICE =MAJOR ADJUSTMENT IN DEMAND Is it a necessity? Are there a low numbers of substitutes? Is it relatively cheap? 3 Yes? Example: pacemakers Is it a necessity? Are there a few number of substitutes? Is it expensive? 3 Nos? Examples: pizza

Similar presentations


 to buy a good or service and the ability to pay for it.>")


