Download presentation
Presentation is loading. Please wait.

1
January 23, 2012 3T Overview RSM 2115 Kevin Stolarick, PhD Research Director

2
Understanding Economic Activity Regional (Smith, Marshall)
")
3
Understanding Economic Activity Regional (Smith, Marshall) Industrial (Porter)
 Industrial (Porter)")
4
Understanding Economic Activity Regional (Smith, Marshall) Industrial (Porter) Education, Skills (Glaeser)
 Industrial (Porter) Education, Skills (Glaeser)")
5
Understanding Economic Activity Regional (Smith, Marshall) Industrial (Porter) Education, Skills (Glaeser) Occupational (Florida)
 Industrial (Porter) Education, Skills (Glaeser) Occupational (Florida)")
6
Understanding Economic Activity Regional (Smith, Marshall) Industrial (Porter) Education, Skills (Glaeser) Occupational (Florida) BOTH
 Industrial (Porter) Education, Skills (Glaeser) Occupational (Florida) BOTH")
7
Why Occupations? Among all people who either work in the IT industry or work in an IT occupation (or both): – 50.2% work in an IT occupation but not in the IT industry – 25.7% work in the IT industry but aren't in an IT occupation – Only 24.1% work in an IT occupation in the IT industry IT Occupations IT Industry
: – 50.2% work in an IT occupation but not in the IT industry – 25.7% work in the IT industry but aren t in an IT occupation – Only 24.1% work in an IT occupation in the IT industry IT Occupations IT Industry.")
8
What is it about Pittsburgh?

9
The “4Ts” Technology Regional Growth

10
The “4Ts” Talent Technology Regional Growth

11
The “4Ts” Talent Tolerance (Inclusiveness) Technology Regional Growth
 Technology Regional Growth")
12
The “4Ts” Talent Tolerance (Inclusiveness) Technology Territory Assets (Amenities) Regional Growth
 Technology Territory Assets (Amenities) Regional Growth")
13
The “4Ts” Talent Tolerance (Inclusiveness) Technology Territory Assets (Amenities) Regional Growth and Prosperity
 Technology Territory Assets (Amenities) Regional Growth and Prosperity")
14
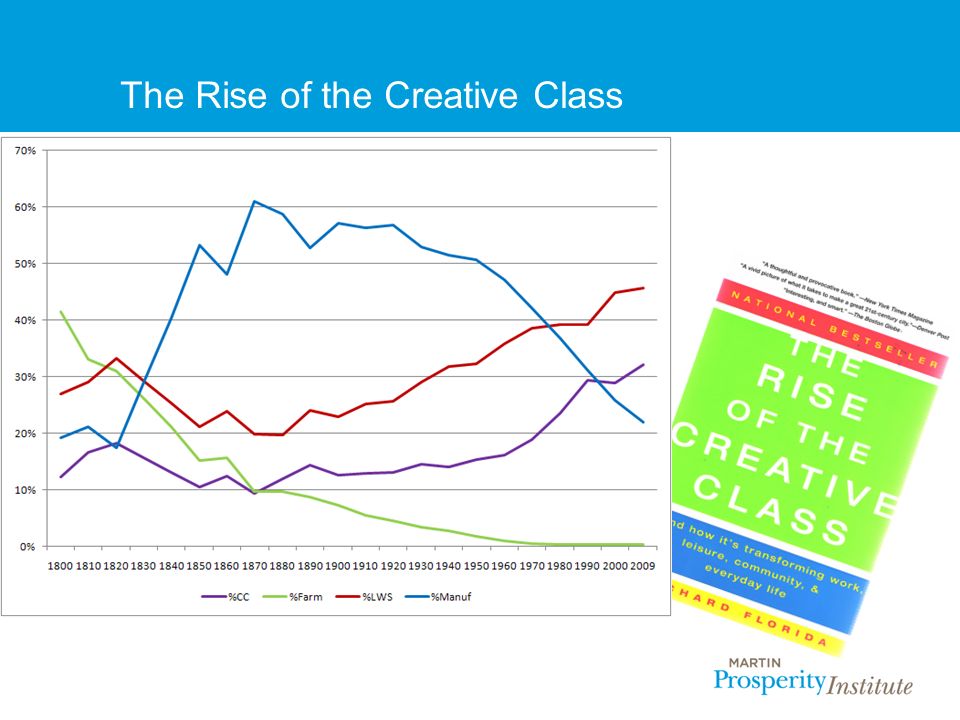
The Rise of the Creative Class

16
What is the Creative Class ? What You Do (Job Occupation) vs. Where You Work (Industry) 10 Year Job Growth Estimate Working Class10% Service Class 14% Creative Class 20%
 10 Year Job Growth Estimate Working Class10% Service Class 14% Creative Class 20%.")
17
Who Works in Creative Class ? Creative Class Economy: TAPE T = Technology and R&D Innovation A = Arts and Culture P = Professional and Managerial E = Educating and Training

18
U.S. Creative Economy KnowledgeServiceWorking Workers (Talent)40,379,52059,769,27031,949,350 % of Workforce30.5%45.1%24.1% % of Wages48.8%30.4%20.6% 18
40,379,52059,769,27031,949,350 % of Workforce30.5%45.1%24.1% % of Wages48.8%30.4%20.6% 18.")
19
Who are the 40,000,000? OccupationsWorkersSalary ($B) T Computer and mathematical3,076,200213.0 Architecture and engineering2,430,250160.9 Life, physical, and social science1,231,07073.4 Healthcare practitioners and technical6,713,780416.5 A Arts, design, entertainment, and media1,727,38079.6 P Management5,892,900541.7 Business and financial operations5,826,140349.6 Legal976,74083.4 Sales and related occupations4,298,620147.7 E Education, training, and library occupations8,206,440371.9 Total40,379,5202,437.7 19
 T Computer and mathematical3,076, Architecture and engineering2,430, Life, physical, and social science1,231, Healthcare practitioners and technical6,713, A Arts, design, entertainment, and media1,727, P Management5,892, Business and financial operations5,826, Legal976, Sales and related occupations4,298, E Education, training, and library occupations8,206, Total40,379,5202,")
20
U.S. Creative Growth OccupationsGrowth (2004-2014) New Jobs (000; by 2014) T Computer and mathematical30.7%1,389 Architecture and engineering17.1%876 Life, physical, and social science16.4%531 Healthcare practitioners and technical25.8%3,047 A Arts, design, entertainment, and media14.9%851 P Management11.3%2,757 Business and financial operations19.1%2,163 Legal15.9%336 Sales and related occupations9.6%408 E Education, training, and library occupations20.0%3,558 20
 New Jobs (000; by 2014) T Computer and mathematical30.7%1,389 Architecture and engineering17.1%876 Life, physical, and social science16.4%531 Healthcare practitioners and technical25.8%3,047 A Arts, design, entertainment, and media14.9%851 P Management11.3%2,757 Business and financial operations19.1%2,163 Legal15.9%336 Sales and related occupations9.6%408 E Education, training, and library occupations20.0%3,")
21
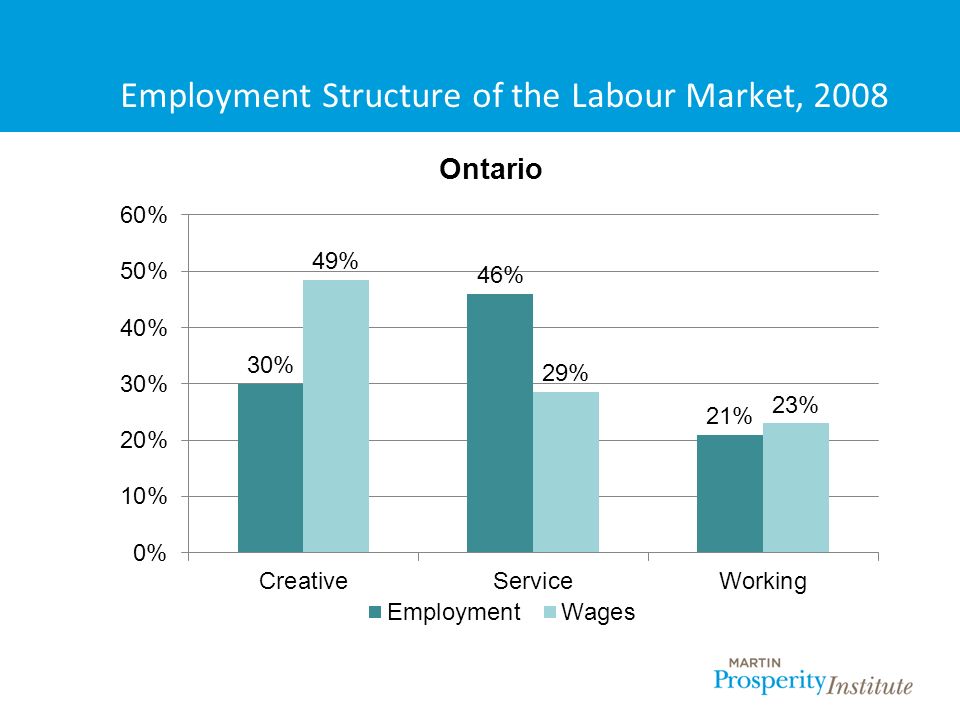
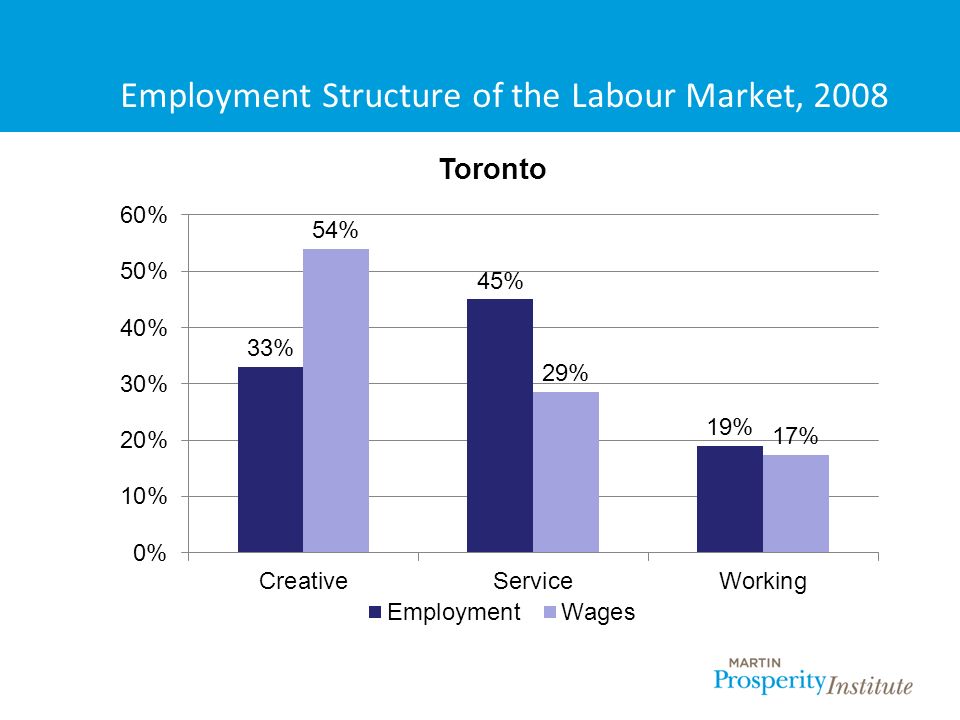
Workforce Structure - Classes ServiceCreativeWorking Canada 7,068,195 46.2% 4,317,125 28.2% 3,154,290 20.6% Ontario 2,700,563 45.6% 1,748,258 29.5% 1,239,065 20.9% Toronto 1,145,000 45.3% 840,718 33.3% 472,835 18.7%

22
Employment Structure of the Labour Market, 2008

25
25 Share of creativity-oriented jobs is increasing

26
26

27
-Creative jobs are more common in larger cities -Eastern Ontario somewhat higher mainly due to Ottawa Creative Ontario 27

28
Creative Jobs as a Percent of Total Employment 28

29
Service Class Jobs as a Percent of Total Employment 29

30
Working Class Jobs as a Percent of Total Employment 30

31
Agricultural Jobs as a Percent of Total Employment 31

32
32 Nearly 80 percent of jobs in Canada are in services industries

33
Employment by Industry in Canada from 1976 to 2006

34
Output by Industry in Canada from 1976 to 2005

35
Unemployment is higher in routine-oriented occupations especially in early 90s recession -35

36
The “4Ts” Talent Tolerance (Inclusiveness) Technology Territory Assets (Amenities) Regional Growth and Prosperity
 Technology Territory Assets (Amenities) Regional Growth and Prosperity")
37
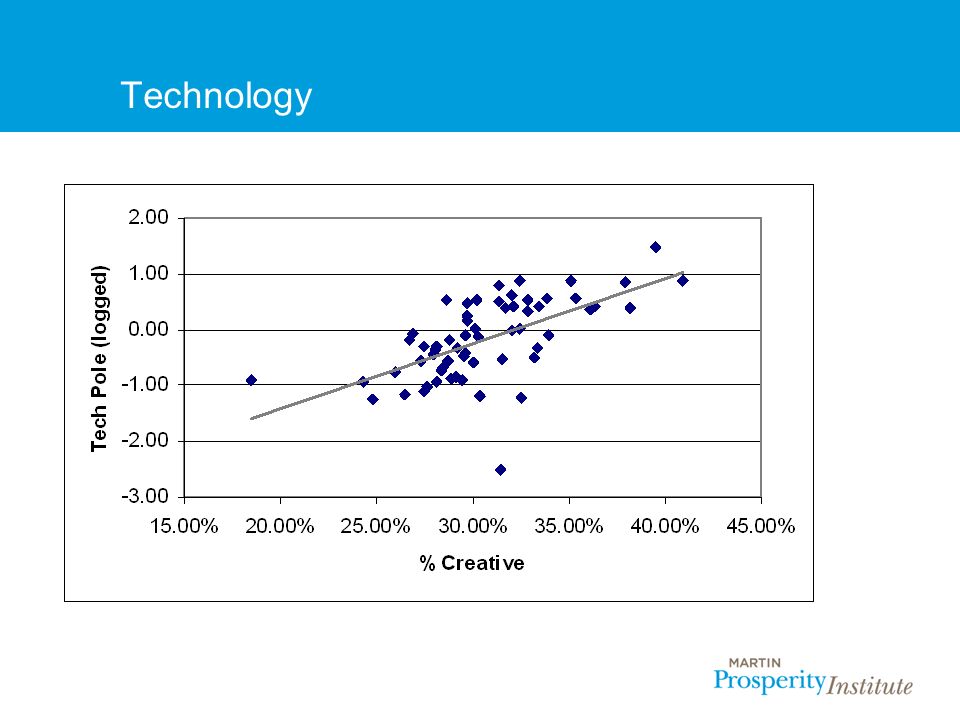
Technology “A high technology base is both a necessary condition for and a result of a region having a strong creative economy. Being known as a "high-tech" region helps to attract the creative workforce, which, in turn, generates new technologies making the region even more high-tech.”

38
Technology High Technology: – Concentration of high-tech companies – Growth of high-tech companies Innovation: – # of patented innovations per 1,000 people – Growth in patented innovations

39
Technology

41
Talent “The concentration of people in the Creative and Super Creative Classes, has a stronger relationship with economic growth. Creative people don't just cluster where the jobs are. They cluster in places that are centers of creativity and also where they like to live. Places need a people climate -- or a creativity climate -- as well as a business climate.”

42
Talent Talent Index (Bachelors Degree and above) % Super Creative (scientists,engineers, artists, musicians, designers) % Creative Workers (super creative + professionals)
 % Super Creative (scientists,engineers, artists, musicians, designers) % Creative Workers (super creative + professionals)")
43
Talent

45
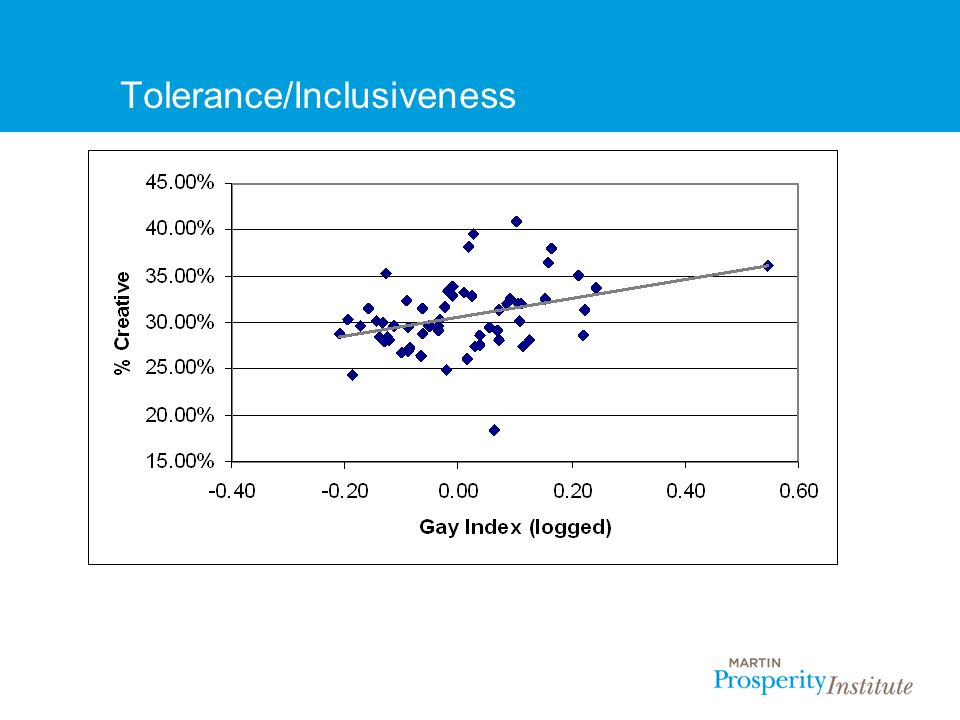
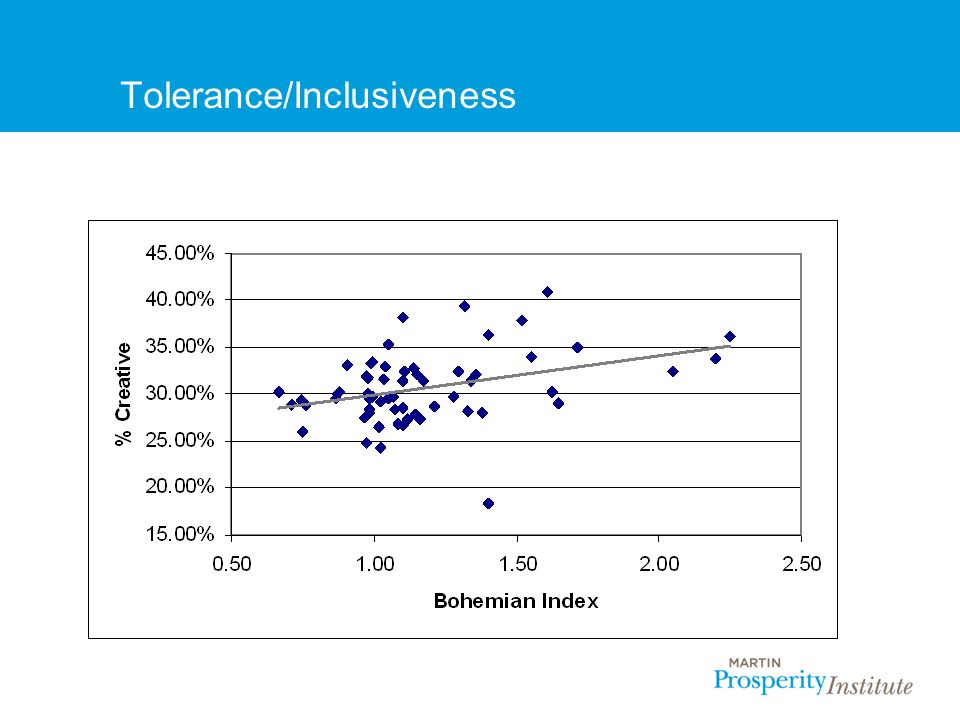
Tolerance/Inclusiveness “Diversity has become a politically charged buzzword. To some it is an ideal and rallying cry, to others a Trojan-horse concept that has brought us affirmative action and other liberal abominations. Creative Class people use the word often, but not to press any political hot buttons. Diversity is simply something they value in all its manifestations.”

46
Tolerance/Inclusiveness Melting Pot Index (% foreign born) Gay/Lesbian Index (% gay & lesbian population) Boho Index (% culturally creative) % Nonwhite & Non-black % Interracial Marriage Composite Diversity Index (CDI)
 Gay/Lesbian Index (% gay & lesbian population) Boho Index (% culturally creative) % Nonwhite & Non-black % Interracial Marriage Composite Diversity Index (CDI)")
47
Tolerance/Inclusiveness

50
Territory Assets “What Creative people look for in communities are abundant high-quality amenities and experiences, an openness to diversity of all kinds, and above all else the opportunity to validate their identities as creative people. Places are valued for authenticity and uniqueness … Authenticity comes from several aspects of a community … It comes from the mix … Authenticity is the opposite of generic.”

51
Territory Assets (Quality of Place) Economy/Growth Housing Culture Climate Education Healthcare Recreation Dis-amenities – Crime, Weather Transportation – Connectedness
 Economy/Growth Housing Culture Climate Education Healthcare Recreation Dis-amenities – Crime, Weather Transportation – Connectedness")
52
Creativity Index “The key to understanding the new economic geography of creativity and its effects on economic outcomes lies in the 3T's of economic development: Technology, Talent, and Tolerance. Each is a necessary but by itself an insufficient condition: To attract creative people, generate innovation and stimulate economic growth, a place must have all three. ”

53
Creativity Index Technology Tolerance (Inclusiveness) Talent LEADING INDICATOR
 Talent LEADING INDICATOR")
54
The “4Ts” Talent Tolerance (Inclusiveness) Technology Territory Assets (Amenities) Regional Growth and Prosperity
 Technology Territory Assets (Amenities) Regional Growth and Prosperity")
55
The Current Picture

56
“Urban” Policy Urban policy is not social policy. 56

57
“Urban” Policy Urban policy is not social policy. Urban policy is economic policy. 57

58
“Urban” Policy Urban policy is not social policy. Urban policy is economic policy. What happens when you’re not “urban”? What’s your economic policy? 58

59
“Urban” Policy What about “non-urban” areas?? Think Big Look Big Use a shotgun, not a rifle (Super secret strategy #4) 59
 59.")
60
Think Big 60

61
Connecting the Disconnected 61

62
Look Big 62

63
Use a Shotgun not a Rifle 63

64
(Super Secret Strategy #4) 64
 64")
65
Thank You Kevin Stolarick kms@rotman.utoronto.ca www.martinprosperity.org

Similar presentations


 initiative. Includes.>")


 UNESCO Chair on “Intermediate cities, urbanization and development”>")


