Download presentation
Presentation is loading. Please wait.

1
www.sei.se/relu Characterizing Rural England using GIS Steve Cinderby, Meg Huby, Anne Owen

2
www.sei.se/relu Scoping study in the Rural Economy & Land Use Programme Aim: To integrate natural and social science data into a spatial dataset that can be used for analysis to inform rural policy- making and provide a knowledge base for furthering policy integration Characterizing Rural England Using GIS

3
www.sei.se/relu

4
The Super Output Area This study uses the new Census Super Output Areas (SOAs) as the base unit for aggregation. SOAs are a new geography designed to improve the reporting of small area census statistics. It is intended that they will eventually become the standard across UK National Statistics. Lower level SOAs have a minimum population of 1000 people with a mean of 1500 people. For rural SOAs, areas range from 0.16km 2 to 684km 2 with a mean size of 18.2km 2.

5
www.sei.se/relu The Rural Definition Classification based on underlying hectare square grid Each square classified into one of 9 “morphological” categories – e.g. small town, village, hamlet Each square assigned a score based on the sparsity of the surrounding area

6
www.sei.se/relu The Rural Definition for OAs

7
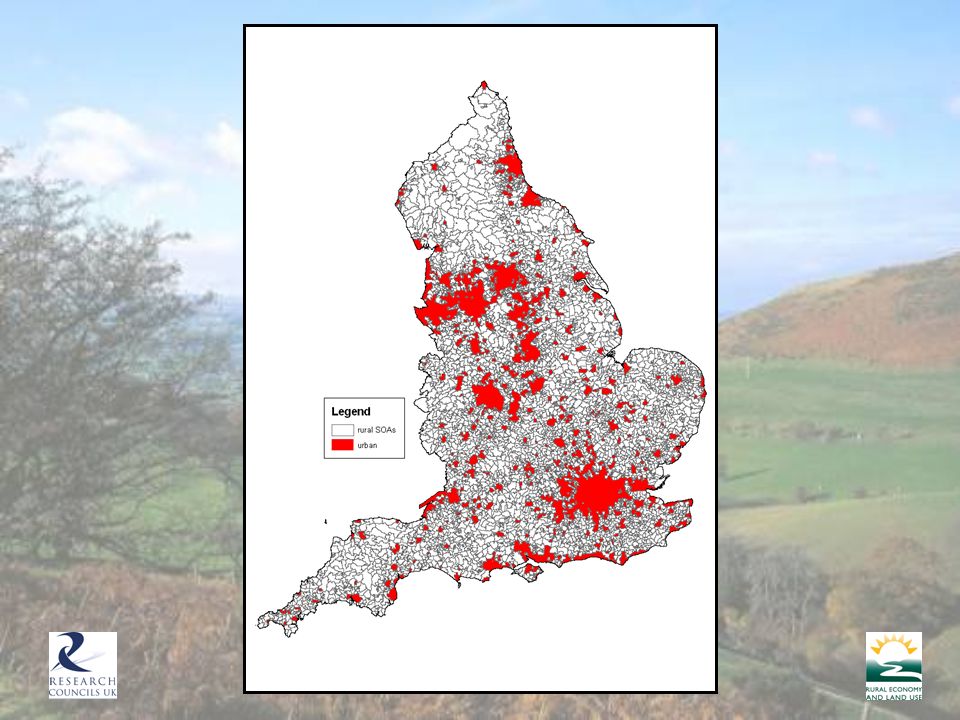
www.sei.se/relu The Rural Definition for SOAs Super Output Areas are either rural or urban SOA is either sparse or less sparse Rural SOAs are either town or village/hamlet 2 urban and 4 rural types

8
www.sei.se/relu
9
Spatial Integration The 2001 Census and 2004 Indices of Deprivation use the Super Output Area as their areal unit. Other variables, particularly environmental datasets, use a different geography, which need to be integrated at SOA level. The problems of geographic integration to a common base unit are well known. This project aims to characterise, minimise and represent errors and uncertainty when data is portrayed at SOA level.

10
www.sei.se/relu Distribution of data Uniform Patchy Continuously varying

11
www.sei.se/relu Geography of data Point Line Area Surface

12
www.sei.se/relu Resolution of data Low High

13
www.sei.se/relu Distribution of non SOA level data Data that have not been collected at SOA level must be assigned to SOAs The nature of the assignation is determined according to the underlying distribution of the data Additional data are required to determine the geography of the distribution

14
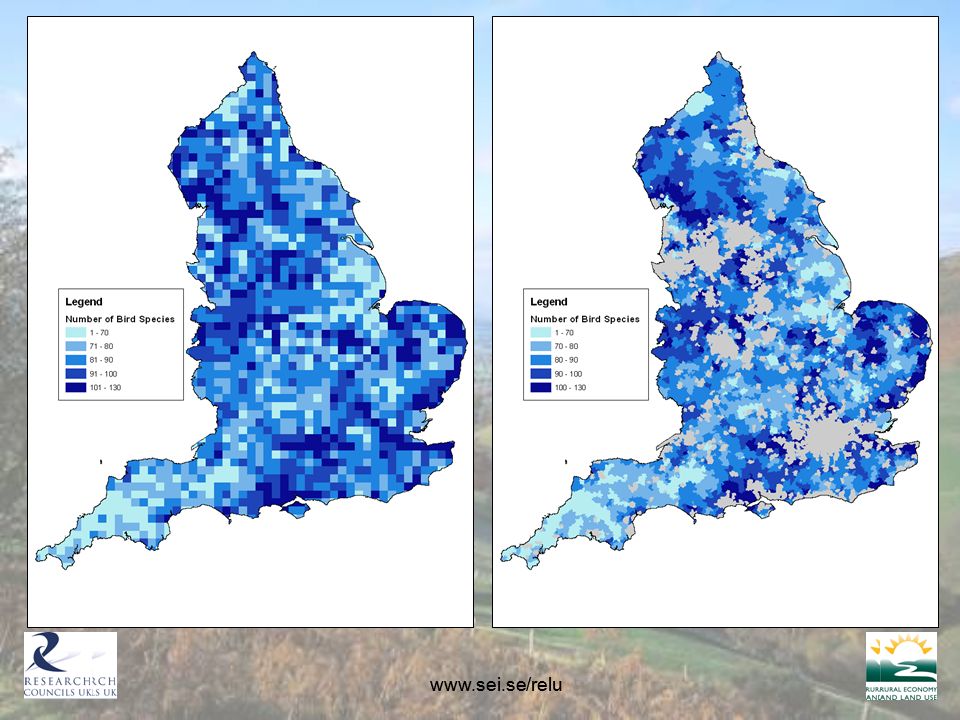
www.sei.se/relu Case Study I: Bird species richness Captured at 10km grid square level Resolution is low Assume uniform distribution throughout grid square Apply area weighted averaging technique to construct data at SOA level

15
www.sei.se/relu 2329 3541 60 m 2 80 m 2 30 m 2 20 m 2 (23 x 60)/190 = 7.26 (29 x 80)/190 = 12.21 (35 x 20)/190 = 3.68 (41 x 30)/190 = 6.47 190 m 2 (7.26 + 3.68 + 12.21 + 6.47) = 30 (2 s.f.) Area Weighted Technique
/190 = 7.26 (29 x 80)/190 = (35 x 20)/190 = 3.68 (41 x 30)/190 = m 2 ( ) = 30 (2 s.f.) Area Weighted Technique")
16
www.sei.se/relu
17
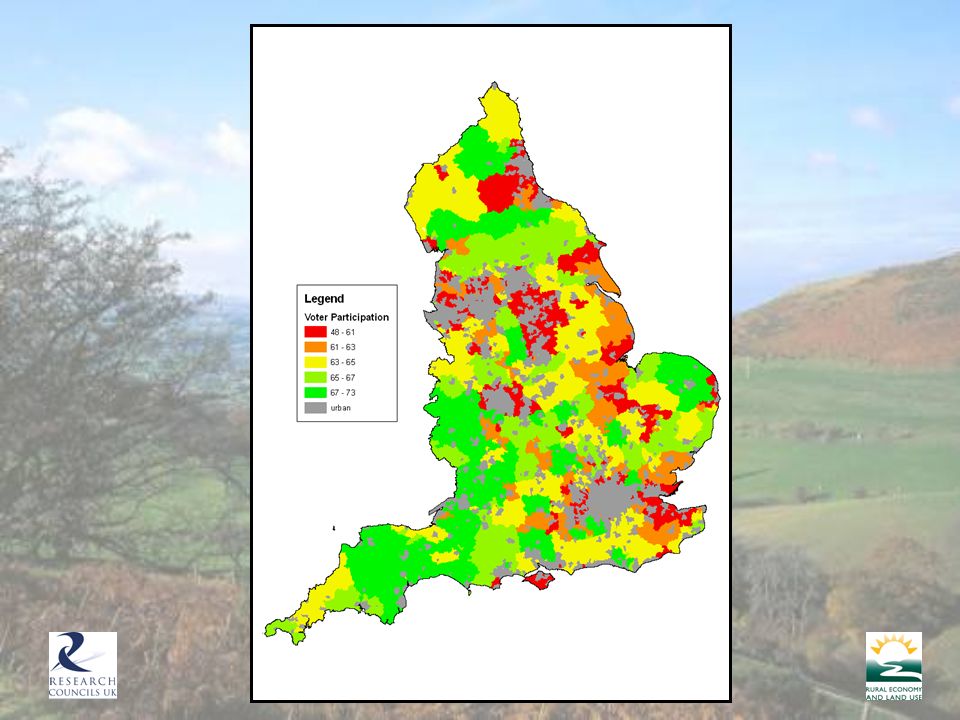
Case Study II: Voter participation Captured at parliamentary ward level Resolution is low Assume patchy distribution of population settlements Apply population weighted averaging technique to construct data at SOA level

18
www.sei.se/relu 0.72 x 900 = 648 0.53 x 600 = 318 1500 people (648 + 318) / 1500 = 64.4% Population Weighted Technique 72%53% 900 600
 / 1500 = 64.4% Population Weighted Technique 72%53%")
19
www.sei.se/relu
20
Case Study III: Air Pollution 1km grid square level Resolution is high Distribution is continuously varying

21
www.sei.se/relu When ‘average’ is not appropriate A weighted average technique masks variation in the data and information on very high, or very low values is lost When considering pollution data, it may be more appropriate to consider maximum pollution found in an SOA rather than the mean

22
www.sei.se/relu Pollution: averaging problem

23
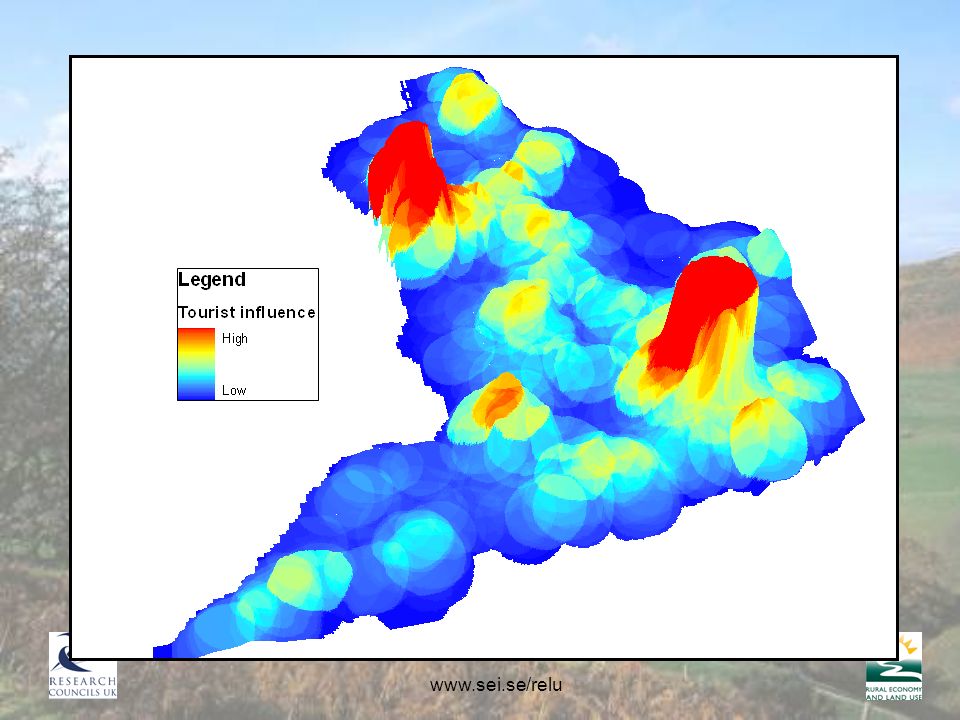
www.sei.se/relu Case Study IV: Impact of Tourism Calculate an indicator showing the effect of tourism on Rural SOAs Use point data of visitor numbers to tourist sites with line data of road network Aim to show tourist ‘intensity’ along area adjacent to roads

24
www.sei.se/relu Tourist Influence

25
www.sei.se/relu
26
Tourist Influence along roads

27
www.sei.se/relu Conclusion Problems of combining data together spatially do not arise because the data is either environmental or socio-economic They depend on the nature of the data Each type must therefore be considered on a case by case basis, using supplementary data on the underlying distribution for mapping to SOA level

Similar presentations


 UPA Package 4, Module 3.>")


