Download presentation
Presentation is loading. Please wait.

1
QuakeSim Project: Portals and Web Services for Geo-Sciences Marlon Pierce Indiana University mpierce@cs.indiana.edu

2
QuakeSim Project Summary Goal is to provide a distributed environment for connecting scientific computing and data resources with Web based user interfaces. QuakeSim’s IT development includes Portals for user interfaces. Web Services for running remote applications and accessing databases Databases for semantic fault models and INSAR(USC) This talk reviews major revisions that we have undertaken since 2006.
 This talk reviews major revisions that we have undertaken since")
3
Some QuakeSim Applications and Their Data Disloc, Simplex Fault models are used to calculate surface displacements (Disloc) using Okada method. Simplex is the inverse. GeoFEST (JPL/CalTech) Finite element code for detailed modeling of fault stresses, seismic displacements, uses fault models as input. Coupled to mesh generation tools Regularized Dynamic Annealing Hidden Markov Method (RDAHMM) (JPL) Time series analysis code, can be applied to GPS and seismic archives. Identifies signal components (possibly associated with underlying physical causes) with no fixed parameters.
 Finite element code for detailed modeling of fault stresses, seismic displacements, uses fault models as input. Coupled to mesh generation tools Regularized Dynamic Annealing Hidden Markov Method (RDAHMM) (JPL) Time series analysis code, can be applied to GPS and seismic archives. Identifies signal components (possibly associated with underlying physical causes) with no fixed parameters..")
4
Portlets + Client Stubs DB Service JDBC DB Job Sub/Mon And File Services Operating and Queuing Systems WSDL Browser Interface WSDL Visualization Or Map Service DB WSDL Host 1 (Quaketables) Host 2 (Grid)Host 3 (G Maps) SOAP/HTTP HTTP(S)
 Host 2 (Grid)Host 3 (G Maps) SOAP/HTTP HTTP(S)")
5
Some Design Choices Build portals out of portlets (Java Standard) Reuse capabilities from our Open Grid Computing Environments (OGCE) project, the REASoN GPS Explorer project, and many TeraGrid Science Gateways. Decorate with Google Maps, Yahoo UI gadgets, etc. Use Java Server Faces to build individual component portlets. Build standalone tools, then convert to portlets at the very end. Use simple Web Services for accessing codes and data. Keep It Stateless … Use Condor-G and Globus job and file management services for interacting with high performance computers. TeraGrid Favor Google Maps and Google Earth for their simplicity, interactivity and open APIs. Generate KML and GeoRSS Use Apache Maven based build and compile system, SVN on SourceForge

6
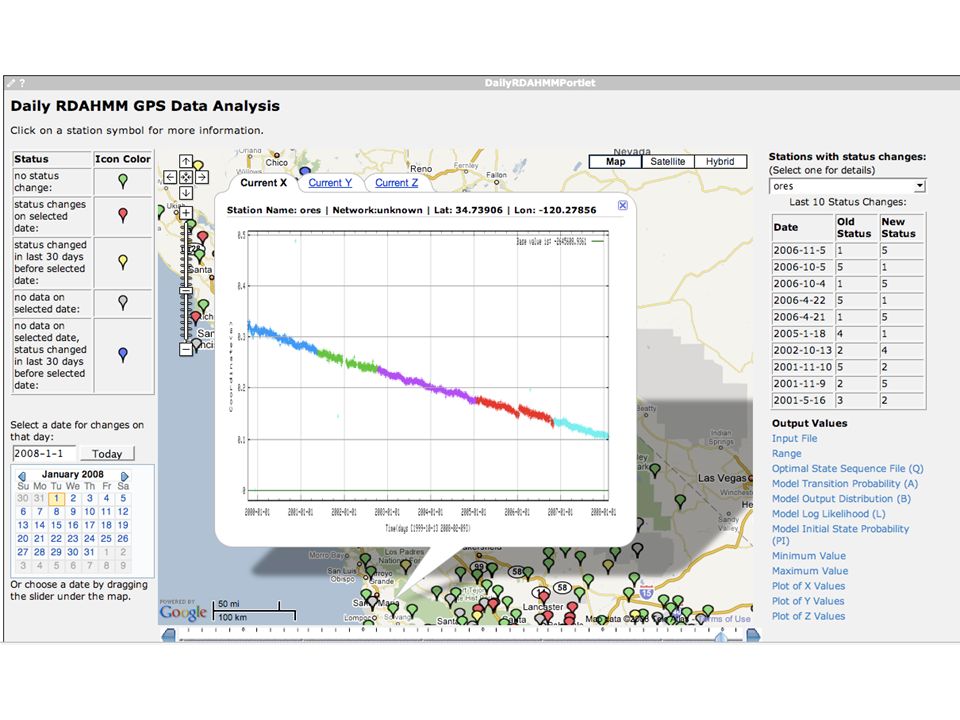
Daily RDAHMM Updates Daily analysis and event classification of GPS data from REASoN’s GRWS.

7
Disloc output converted to KML and plotted.

8
Simplex refines fault models from GPS displacements

9
TeraGrid Supercomputing Resources (GPIR)
")
10
UCSB’s Queue Prediction Service (QBETS) Forecasts time you will wait in the queue on various TG super computers. Inherited from OGCE project.

11
GeoFEST Finite Element Modeling portlet and plotting tools

12
Enterprise ApproachWeb 2.0 Approach JSR 168 PortletsGadgets, Widgets Server-side integration and processing AJAX, client-side integration and processing, JavaScript SOAPRSS, Atom, JSON WSDLREST (GET, PUT, DELETE, POST) Portlet ContainersOpen Social Containers (Orkut, LinkedIn, Shindig); Facebook; StartPages User Centric GatewaysSocial Networking Portals Workflow managers (Taverna, Kepler, etc) Mash-ups Grid computing: Globus, condor, etcCloud computing: Amazon WS Suite, Xen Virtualization
 Portlet ContainersOpen Social Containers (Orkut, LinkedIn, Shindig); Facebook; StartPages User Centric GatewaysSocial Networking Portals Workflow managers (Taverna, Kepler, etc) Mash-ups Grid computing: Globus, condor, etcCloud computing: Amazon WS Suite, Xen Virtualization")
13
What Is a Gadget? Simple gadgets for getting a Grid proxy credential and running remote commands. Both run on my own Web server.

14
Google Reader and GeoRSS

15
Google Maps and GeoRSS

16
Google Earth and KML

17
More Information Email: mpierce@cs.indiana.edu QuakeSim Web Site: www.quakesim.org Portal URL: http://gf7.ucs.indiana.edu:8080/gridsphere Portal SourceForge Page: https://sourceforge.net/projects/crisisgrid Code SVN: http://crisisgrid.svn.sourceforge.net/viewvc/crisisgrid/

18
Acknowledgments QuakeSim work is funded by NASA AIST (A. Donnellan, PI) and ACCESS (Y. Bock, PI) programs. Indiana University developers: Galip Aydin, Xiaoming Gao, Zhigang Qi Robert Granat (JPL), Jay Parker (JPL), Maggi Glasscoe (JPL), John Rundle (UC-Davis), Harout Nazerian (JPL), Rami Al-Ghanmi (USC), Dennis Mcleod (USC), Paul Jamason (Scripps), Ruey-Juin Chang (Scripps), Gerry Simila (CSUN)
 and ACCESS (Y. Bock, PI) programs. Indiana University developers: Galip Aydin, Xiaoming Gao, Zhigang Qi Robert Granat (JPL), Jay Parker (JPL), Maggi Glasscoe (JPL), John Rundle (UC-Davis), Harout Nazerian (JPL), Rami Al-Ghanmi (USC), Dennis Mcleod (USC), Paul Jamason (Scripps), Ruey-Juin Chang (Scripps), Gerry Simila (CSUN).")
19
Stop Talking Now, Champ

20
QuakeSim, Version 1Reason to ReviseQuakeSim, Version 2 Application Web Service for wrapping a.out executables. Execution management service built with Apache Ant. Services too coupled to portal; no simple WSDL programming interface; could not be used in workflow engines; not self contained Give each code a proper service interface. Retain Apache Ant core but extend. Keep WSDL message structure simple (Strings, ints, doubles, URLs), wrapped as Java Beans File Management ServiceUnnecessary, too coupled to Apache Axis 1.0 HTTP GET, URLs Context Management Service manages persistent portal sessions using recursive XML structure. Too slow (file system); didn’t scale; XML databases didn’t mature; Object-Relational Mappings (ORM) not efficient Using DB40; all services communicate with easily XML serializable JavaBeans. OGC-compatible map and data services Too complicated; ORM is a big overhead. Google Maps, KML generating services Serial job submissionNSF TeraGrid and Open Science Grid run full time production Grids for HPC. Condor-G/Birdbath based job management extensions to GeoFEST service.
, wrapped as Java Beans File Management ServiceUnnecessary, too coupled to Apache Axis 1.0 HTTP GET, URLs Context Management Service manages persistent portal sessions using recursive XML structure. Too slow (file system); didn’t scale; XML databases didn’t mature; Object-Relational Mappings (ORM) not efficient Using DB40; all services communicate with easily XML serializable JavaBeans. OGC-compatible map and data services Too complicated; ORM is a big overhead. Google Maps, KML generating services Serial job submissionNSF TeraGrid and Open Science Grid run full time production Grids for HPC. Condor-G/Birdbath based job management extensions to GeoFEST service..")
21
Grid Job Submission Globus provides a universal queuing system interface. PBS, LoadLeveler, Sun Grid Engine, LSF We chose Condor-G as our job management software for submitting jobs to HPC queuing systems. University of Wisconsin Works with Globus, Matlab DCE, Unicore, etc. We co-locate Condor-G with our GeoFEST Web Service. Communication is through Birdbath, Condor’s Web Service interface. So GeoFEST service API is more or less the same, just now Grid enabled. We also plan to release a general version of this service. Condor command line and Birdbath have different names for job description parameters. Big Easter Egg hunt to find this, but now we know.

22
Portlet Summary RDAHMMSet up and run RDAHMM, query Scripps GRWS GPS Service, maintain persistent user sessions. ST_FilterSimilar to RDAHMM portlet; ST_Filter has much more input. Station MonitorShows GPS stations on a Google Map, displays last 10 minutes of data. Real Time RDAHMMDisplays RDAHMM results of last 10 minutes of GPS data in a Google map. Daily RDAHMMCalculates, updates RDAHMM event classifications with daily updated GPS data from SOPAC’s GRWS service (14 day delay, but uses all the data). GeoFESTCreate input geometries, generate FE meshes, run parallel FEM solvers. Disloc, SimplexCalculate service displacements from fault models.
. GeoFESTCreate input geometries, generate FE meshes, run parallel FEM solvers. Disloc, SimplexCalculate service displacements from fault models..")
23
Security Concerns They’ll see the Big Board!

27
QuakeSim Distributed Environment for Modeling Observations

28
Managing Real Time GPS Data Slides from Galip Aydin

30
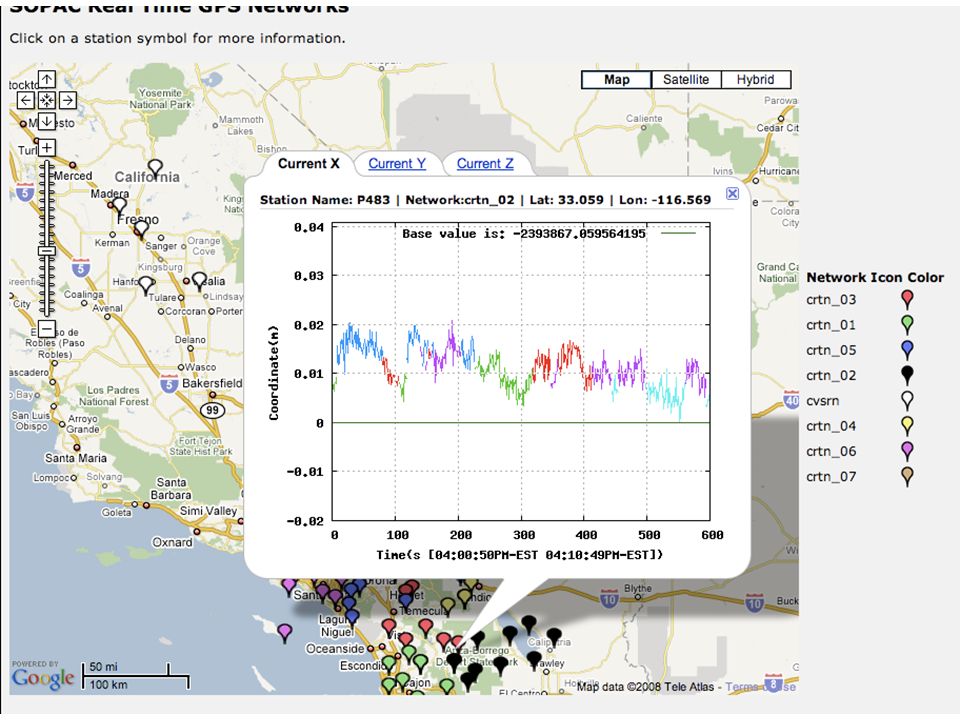
California Real Time Network Network Data Rates Message Format TimeRYOASCIIGML CRTN GPS Site Positions (9 Stations) 1 second1.5KB4.03KB48.7KB 1 hour5.31MB14.18MB171.31MB 1 day127.44MB340.38MB4.01GB 1 month3.8GB9.97GB123.3GB 1 year45.8GB119.67GB1.41TB Entire SCIGN Network (250 stations) 1year1.23TB16.18TB160TB Continuous GPS Stations (CGPS) are depicted as triangles while the Real-Time stations are represented as circles. Image is obtained from SOPAC GPS Explorer at http://sopac.ucsd.edu/projects/realtime How does one manage all the data generated by the 85 stations? How can you get just the data you want? Note this is fundamentally different from traditional request/response style Web Services.

31
31 Processing Real-Time GPS Streams ryo2nb Raw Data 7010 7011 7012 RYO Ports NB Server ryo2asc ii ascii2gm l ascii2pos Single Station Displaceme nt Filter Station Health Filter RDAHMM Filter Scripps RTD Server Scripps RTD Server ryo2nb Raw Data ryo2asc ii ascii2pos Single Station RDAHMM Filter A Complete Sensor Message Processing Path, including a data analysis application. /SOPAC/GPS/CRTN01/RY O /SOPAC/GPS/CRTN01/AS CII /SOPAC/GPS/CRTN01/PO S /SOPAC/GPS/CRTN01/DSM E GPS Networks

32
32 Application Integration with Real-Time Filters Station Monitor Filter records real-time positions for 10 minutes and calculates position changes Graph Plotter Application creates visual representation of the positions. RDAHMM Filter records real-time positions for 10 minutes and invokes RDAHMM application which determines state changes in the XYZ signal. Graph Plotter Application creates visual representation of the RDAHMM output.

33
NB Server RYO To ASCII Converter Simple Filter RYO Publisher 1 RYO Publisher 2 RYO Publisher n 33 2 – Multiple Publishers Test We add more GPS networks by running more publishers. The results show that 1000 publishers can be supported with no performance loss. This is an operating system limit. Topi c 1A Topi c 1B Topi c 2 Topi c n

34
34 4 – Multiple Brokers Test NaradaBrokering allows creation of Broker networks. We create a two-broker network. Messages published to first broker can be received from the second broker. We take timings on each broker. We connect 750 clients to each broker and run for 24 hours. We chose 750 clients to stay well below the saturation limit. The results show that the performance is very good and similar to single broker test. NB Server 1 NB Server 2 RYO To ASCII Converter Simpl e Filter 1 RYO Publisher Topi c 1A Topi c 1B Simpl e Filter 2 Simple Filter 750 Simple Filter 751 Simple Filter 752 Simple Filter 1500 Topi c 1B NB Serve r 2

Similar presentations

>")


 Marlon Pierce (IU)>")


