Download presentation
Presentation is loading. Please wait.

1
Bullet slide Finding Leaks and Prioritizing Repairs Integrating Leak Quantification into Safety Programs Pipeline Safety Trust – 2015 Annual Conference N. Jonathan Peress Environmental Defense Fund

2
Key Points EDF’s Google mapping project demonstrates that new practical methods for detecting and sizing leaks are becoming available For LDCs, quantification benefits customers, utilities, the environment and safety Explain how flow volume quantification improves safety and hazard assessment models Integrating quantification into safety programs and regulations for distribution and transmission Next steps – with utilities and regulators

3
Methane venting and leaks… Gas storage tank Same tank, same time, infrared camera view …an increasingly ‘visible’ problem

4
CH 4 traps more heat than CO 2…

6
EDF/Google/CSU Method Data is collected by driving Street View cars, specially equipped with methane sensors Measure: methane, wind speed and direction, GPS location Streets are driven multiple times to verify readings Colorado State University & EDF created algorithms to calculate leak rate: Allows estimation of relative leak location and magnitude Algorithms were validated using utilities known leaks

7
Results edf.org/methanemaps Boston Indianapolis CityMiles driven/ leak found Boston, MA1 Indianapolis, IN200 Staten Island, NY1 Syracuse, NY2 Burlington, VT10

10
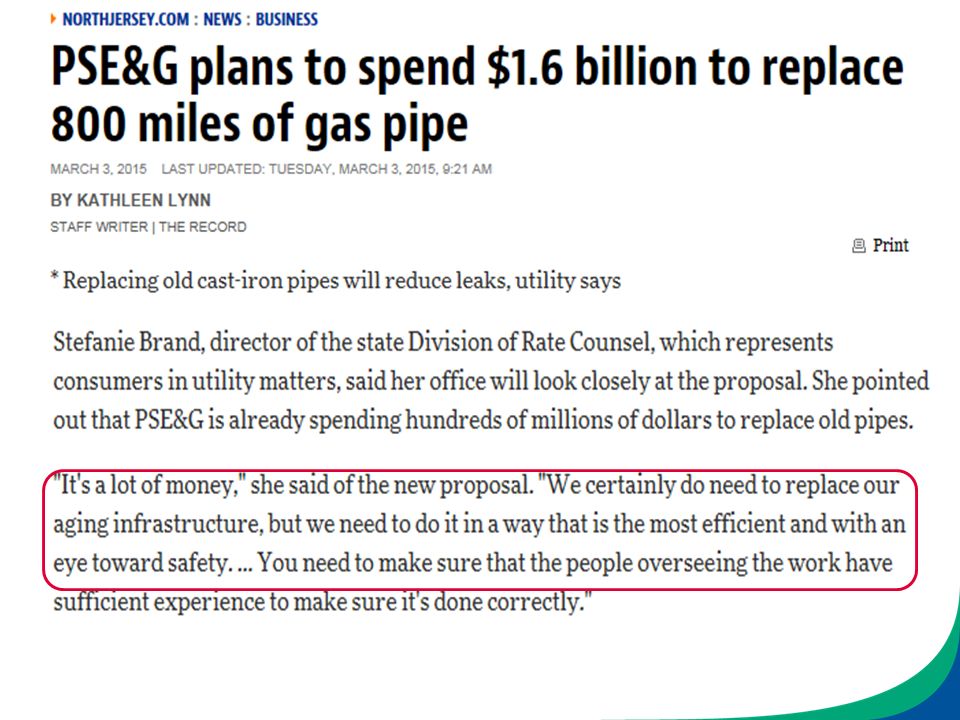
Big Idea – From a Smart Utility and Regulator Validate need for and benefits of replacement programs (before and after) Using quantification to prioritize and enhance cost-effectiveness –Project management tool Reduce lost and unaccounted for gas Provide public information and education Consider what is happening in Chicago, New Jersey, Philadelphia and many other leak-prone systems
 Using quantification to prioritize and enhance cost-effectiveness –Project management tool Reduce lost and unaccounted for gas Provide public information and education Consider what is happening in Chicago, New Jersey, Philadelphia and many other leak-prone systems")
13
A small fraction of sites and components contributes the majority of emissions.

14
New Survey Techniques Prioritize Reasonably Well Cumulative Distribution Curve

18
Key Partners Utilities (NYSEARCH): Consolidated Edison; Central Hudson Gas & Electric Corporation; National Grid NY; National Fuel Gas Distribution Corporation; New York State Electric & Gas Corporation; Rochester Gas & Electric; Orange & Rockland Utilities; Pacific Gas & Electric Company; Public Service Electric & Gas Company; Southern California Gas Company; Xcel Energy Working with other utilities who have reached out to EDF including Peoples Natural Gas (Pittsburgh) State PUCs; Consumer Advocates; Safety Regulators; PHMSA
: Consolidated Edison; Central Hudson Gas & Electric Corporation; National Grid NY; National Fuel Gas Distribution Corporation; New York State Electric & Gas Corporation; Rochester Gas & Electric; Orange & Rockland Utilities; Pacific Gas & Electric Company; Public Service Electric & Gas Company; Southern California Gas Company; Xcel Energy Working with other utilities who have reached out to EDF including Peoples Natural Gas (Pittsburgh) State PUCs; Consumer Advocates; Safety Regulators; PHMSA")
19
Integration with and by Utilities: Why? US DOT “Call to Action” for leak-prone infrastructure replacement PHMSA DIMP Program –Use of all reasonably available information to evaluate safety threats –Leak management requires “evaluating severity of leaks” Enhanced risk identification –Use of continuously improving technology –Emphasis on “being more predictive” –Safety models, visualize and integrate data –Reduce leak backlogs

20
Leak Quantification Enhances Hazard Assessment Hazard Index Algorithmic Model

21
Quantification applies to transmission (from PHMSA Risk Management workshop)
")
22
More to do: Operationalization –Validating quantification methods (e.g., NYSEARCH) –Equipment - Several providers developing –Software Requirements and data processing –GIS System Integration into IMP programs - PHMSA More protective than Natural Gas STAR DI&M –DI&M recognizes benefits of quantification –But based on whether profitable to repair
 –Equipment - Several providers developing –Software Requirements and data processing –GIS System Integration into IMP programs - PHMSA More protective than Natural Gas STAR DI&M –DI&M recognizes benefits of quantification –But based on whether profitable to repair")
23
EDF STUDIES BY SUPPLY CHAIN SEGMENT (roughly 30 total papers) 1. NOAA Denver- Julesburg 2. NOAA Barnett 3. Coordinated Campaign 4. UT Phase 1 5. UT Phase 2 Pneumatics Liquid Unloadings 6. HARC/EPA 7. CSU Study Methods Measurements National Scale-up 8. CSU Study Measurements National Scale-up 13. WVU Study 14. Pilot Projects 15. Gap Filling 16. Project Synthesis Results public Submitted, not yet public Almost ready for submission Not yet submitted 12 papers Barnett synthesis 11. WSU Multi-City 9. Methane Mapping 10. Boston Study 12. Indianapolis Study

24
Gathering facilities are one of the largest sources of methane.

26
Advancing Solutions (with information) Safety systems must always achieve and advance the state of the art Stakeholders and public benefit from information Resolve disconnect between infrastructure condition (leaks) and expenditures What leaks can and should be abated/prevented? Requires better data

Similar presentations


 644-8983>")


 384.6330 Davis Power Consultants Strategic Location of Renewable Generation Based on Grid Reliability.>")


 Lessons Learned from Natural Gas STAR Partners Producers Technology Transfer Workshop Devon Energy and EPA’s.>")

 Leak detection for.>")

