Download presentation
Presentation is loading. Please wait.

1
Atomic-absorption spectroscopy
Lab no. 6 Atomic-absorption spectroscopy

2
Introduction In analytical chemistry, Atomic absorption spectroscopy (AAS) is a technique for determining the concentration of a particular metal element (e.g. Fe, Cu, Al, Pb, Ca, Zn)in a sample ( water, medicine, food) . Atomic absorption spectroscopy can be used to analyze the concentration of over 62 different metals in a solution.
 is a technique for determining the concentration of a particular metal element (e.g. Fe, Cu, Al, Pb, Ca, Zn)in a sample ( water, medicine, food) . Atomic absorption spectroscopy can be used to analyze the concentration of over 62 different metals in a solution.")
3
Technique Atomic-absorption (AA) spectroscopy uses the absorption of light to measure the concentration of gas-phase atoms. Since samples are usually liquids or solids, the analyte atoms must be vaporized or atomized in a flame or graphite furnace.
 spectroscopy uses the absorption of light to measure the concentration of gas-phase atoms. Since samples are usually liquids or solids, the analyte atoms must be vaporized or atomized in a flame or graphite furnace.")
4
Steps The steps are involved in turning a liquid sample into an atomic gas: Desolvation – the liquid solvent is evaporated, and the dry sample remains. Vaporization or Volatilization – the solid sample vaporizes to a gas.

5
Instrumentation

6
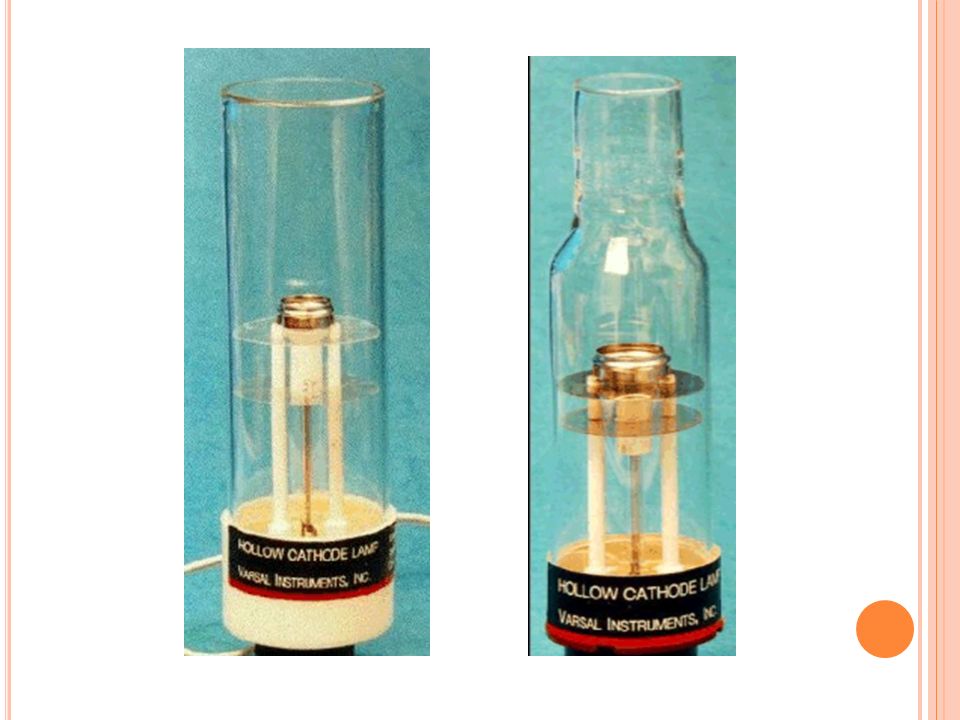
Light Source: Hollow Cathode Lamp
The light that is focused into the flame is produced by a hollow cathode lamp. Inside the lamp is a cylindrical metal cathode containing the metal for excitation, an anode and inert gas. When a high voltage is applied across the anode and cathode, the metal atoms in the cathode are excited into producing light with a certain emission spectrum.

7
The type of hollow cathode tube depends on the metal being analyzed
The type of hollow cathode tube depends on the metal being analyzed. For analyzing the concentration of copper in an ore, a copper cathode tube would be used, and likewise for any other metal being analyzed. The electrons of the atoms in the flame can be promoted to higher orbitals for an instant by absorbing a set quantity of energy (a quantum).
.")
9
Atomizer AA spectroscopy requires that the analyte atoms be in the gas phase. Ions or atoms in a sample must undergo desolvation and vaporization in a high-temperature source such as a flame or graphite furnace. Flame AA can only analyze solutions, while graphite furnace AA can accept solutions, slurries, or solid samples.

10
Flame AA uses a slot type burner to increase the path length, and therefore to increase the total absorbance (see Beer-Lambert law). Sample solutions are usually aspirated with the gas flow into a nebulizing /mixing chamber to form small droplets before entering the flame.

12
Flame Different temperatures required for different elements
Air-Acetylene flame Preferred flame for 35 elements Temperature of 2300 C Nitrous Oxide-Acetylene flame Temperature of 2900 C

13
The graphite furnace has several
advantages over a flame. It is a much more efficient atomizer than a flame and it can directly accept very small absolute quantities of sample. Samples are placed directly in the graphite furnace and the furnace is electrically heated in several steps to dry the sample, ash organic matter, and vaporize the analyte atoms.

14
The gas-phase atoms absorb ultraviolet or visible light and make transitions to higher electronic energy levels.

15
a flame atomic-absorption spectrometer
a graphite-furnace atomic-absorption spectrometer:

16
Monochromator Which is set to isolate the radiation at the specified wavelength and travels into the detector.

17
Detector Photo multiplier tube Extremely sensitive
Can detect single photons Measures the intensity of the beam of light. When some of the light is absorbed by metal, the beam's intensity is reduced. The detector records that reduction as absorption. That absorption is shown on output device by the data system

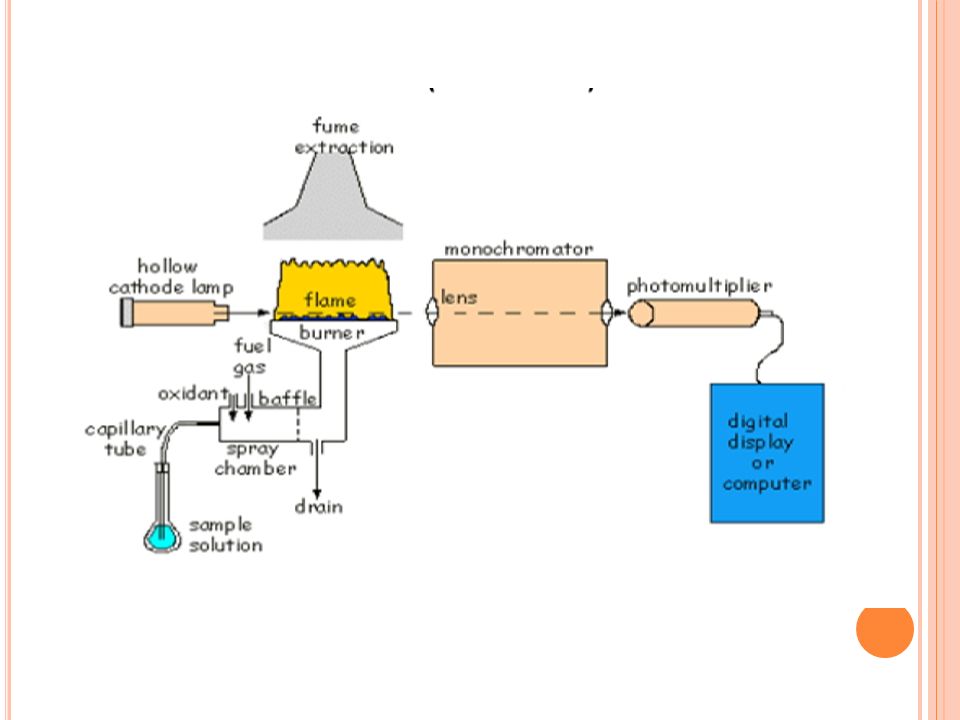
18
Schematic of an atomic-absorption experiment

19
Getting a Concentration
Flame Measures absorbance proportional to the ______________ of the sample Analysis in the mg/L range (ppm) Graphite Furnace Measures an absorbance peak with an area proportional to _______ of the sample Analysis in the mg/L range (ppb) concentration mass
 Graphite Furnace. Measures an absorbance peak with an area proportional to _______ of the sample. Analysis in the mg/L range (ppb) concentration. mass.")
20
We can find the concentrations of a sample running a series of calibration standards through the instrument. By plotting the absorption versus the concentrations of the standards, a calibration curve can be plotted. We can then look at the absorption for a sample solution and use the calibration curves to determine the concentration of a sample.

Similar presentations
I>")
 determination of elements not compounds needs radiation source high temperature for atomization Atomization a.>")
 Steve Badger and Charity Wessel.>")


>")
>")

 Atomic X-ray Spectrometry (Ch 12) Atomic Mass.>")


