Download presentation
Presentation is loading. Please wait.

1
Interpreting Hemodynamic Data. Pressures Flow and Resistance Estimations S.RADHAKRISHNAN FORTIS ESCORTS HEART INSTITUTE AND RESEARCH CENTRE, NEW DELHI

2
PROF R TANDON 1928- 2014. FRIEND AND MENTOR

3
Questions: Before, During and After Catheterization Why are we catheterizing this patient with congenital heart disease? What specific information is being sought? What factors can influence interpretation of the information?

4
Why are we Catheterizing this patient with Congenital Heart Disease? So that we can take a better informed decision on management

5
Why are we catheterizing this patient with Congenital Heart Disease? What are the indications for performing Cardiac Catheterization? Anatomic Definition (Angiography) Physiologic Quantification (Hemodynamics) Pressure Flows Resistances
 Physiologic Quantification (Hemodynamics) Pressure Flows Resistances.")
6
PRESSURES Catheter tipped manometers are still considered gold standard. Rarely available in clinical setting Fluid filled tubings and catheter are prone to errors Great pains to be taken to minimize errors Level of transducer in relation to chest Constant check on calibration and zeroing during procedure Recognize under and over damping of pressures and correct

7
Why are we catheterizing this patient with Congenital Heart Disease? Flows and Resistances: Operability in borderline situations Before single ventricle palliation (Glenn / Fontan)
.")
8
When Do We Need to Catheterize Patients With Left to Right Shunts? Clear clinical /noninvasive evidence of a large left – right shunt. Typically younger patients Operable Inoperable: Eisenmenger physiology Clear evidence of shunt reversal resulting from high PVR. Typically older patients Borderline situation: PVR elevated by clinical/non- invasive assessment. Degree of elevation of PVR (and therefore operability) uncertain.
 uncertain..")
10
LV RV LA LV RA RV Clearly Operable: Cath not required

11
When Do We Need to Catheterize Patients With VSD, PDA? Clear clinical /noninvasive evidence of a large left – right shunt Operable Clear evidence of shunt reversal resulting from high PVR. Failure to thrive, precordial activity, mid diastolic murmur at apex, Cardiac enlargement, pulmonary blood flow Q in lateral leads on ECG, good LV forces LA/LV enlargement, exclusively L-R flows across the defect Inoperable Cyanosis, desaturation at rest (<93%) or on walking, quiet precordium, no MDM Normal heart size, peripheral pruning No Q in lateral leads, predominant RV forces No LA LV enlargement, significant R-L flows across the defect Borderline clinical non-invasive data: uncertain operability
 or on walking, quiet precordium, no MDM Normal heart size, peripheral pruning No Q in lateral leads, predominant RV forces No LA LV enlargement, significant R-L flows across the defect Borderline clinical non-invasive data: uncertain operability.")
12
26 year old Blue Single loud S2

13
Clearly Inoperable: Cath not required? Sometimes performed before “labeling as inoperable” RV LV RA LA

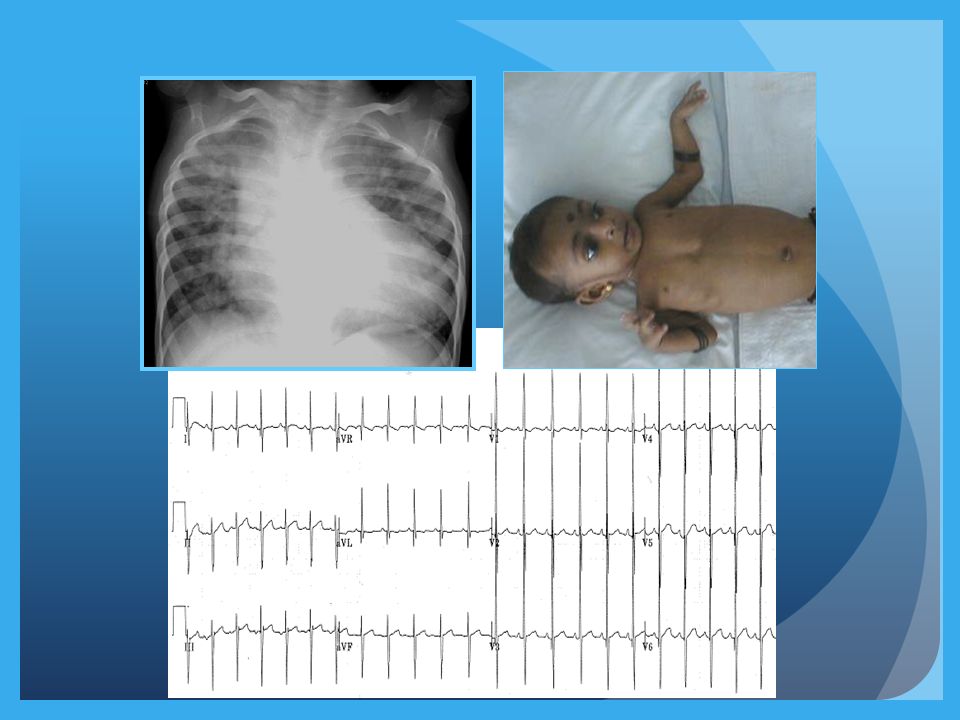
14
14-year-old boy 19.7 Kg Pink (95%) Closely split S2 Loud P2 No apical MDM, ECG RVH, no Q in lat leads
 Closely split S2 Loud P2 No apical MDM, ECG RVH, no Q in lat leads")
15
LA LV RA RV

16
Ao LA LV Ao PA PDA Operability Uncertain : Cardiac cath recommended

17
Questions: Before, During and After Catheterization Why are we catheterizing this patient with congenital heart disease? What specific information is being sought? What factors can influence interpretation of the information?

18
What Specific Information is being sought? How much is the shunt? - Ratio of pulmonary to systemic blood flow (Qp: Qs ratio) PVR / PVRI; PVR/SVR ratio? Ventricular end diastolic pressure (for Single Ventricle physiology)
 PVR / PVRI; PVR/SVR ratio. Ventricular end diastolic pressure (for Single Ventricle physiology).")
19
Flow Calculations Applying Fick’s Principle Oxygen Consumption O 2 content 1O 2 Content 2 Flow =

20
Flow Measurements: O 2 Content O 2 Content (ml of O 2 per 100 ml of blood) Hb (gm/100 ml of blood) X 1.36 X fractional saturation of blood + Dissolved Oxygen in plasma
 Hb (gm/100 ml of blood) X 1.36 X fractional saturation of blood + Dissolved Oxygen in plasma")
21
Dissolved O 2 0.003 ml of O 2 is dissolved in 100 ml plasma for every torr (mm Hg) of Oxygen tension Should be taken into consideration whenever PO 2 exceeds 100 mm Hg after O 2 is administered
 of Oxygen tension Should be taken into consideration whenever PO 2 exceeds 100 mm Hg after O 2 is administered")
22
Oxygen Saturation Measurements Direct saturation measurements and not ABGs Saturations should be measured in the lab Spectrophotometer (measures absorption of transmitted light at a given wavelength)
")
23
HEAMOXYMETER

24
Flows Pulmonary blood flow Oxygen consumption PVO2 contentPA O2 Content Systemic blood flow (cardiac output) Oxygen consumption Arterial O2 content Mixed V O2 Content
 Oxygen consumption Arterial O2 content Mixed V O2 Content")
25
Flows Pulmonary blood flow Oxygen consumption Systemic blood flow (cardiac output) Oxygen consumption (Ao sat – MV sat) (Hb conc) (1.36) (10) (PV sat – PA sat) (Hb conc) (1.36) (10)
 Oxygen consumption (Ao sat – MV sat) (Hb conc) (1.36) (10) (PV sat – PA sat) (Hb conc) (1.36) (10)")
26
Shunt Ratio (Qp/Qs) Only O 2 saturations are needed Aortic sat – Mixed Venous sat Pulmonary Venous sat – PA sat
 Only O 2 saturations are needed Aortic sat – Mixed Venous sat Pulmonary Venous sat – PA sat")
27
Shunt Calculations in admixture lesions Effective Systemic (QeS) or Pulmonary blood flow (QeP) Oxygen Consumption (PV sat – MV sat) (Hb conc) (1.36) (10) L-R Shunt = Qp – Qep; R-L shunt = Qs - Qes
 or Pulmonary blood flow (QeP) Oxygen Consumption (PV sat – MV sat) (Hb conc) (1.36) (10) L-R Shunt = Qp – Qep; R-L shunt = Qs - Qes")
28
Flow Calculations: Sources of Error Sampling for O 2 saturation estimation Streaming Partial wedging

29
O 2 Saturation Errors Getting samples in different physiologic states Diluted samples Air bubble in syringe Delay in sending samples Machine calibration Extrapolating from ABG Failure to account for dissolved O2 Carboxyhemoglobin

30
O 2 Saturation Errors Non representative sampling Pulmonary vein Right atrium IVC Aorta in presence of PDA with R-L flow

31
Mixed Venous Saturation In absence of L - R shunt: PA In presence of L - R shunt: ?SVC ? Flamm Formula (3 SVC +1IVC / 4) Anesthesia
 Anesthesia.")
32
Oxygen Consumption Measured: Douglas bag, Spirometer Flow through devices (Waters; Sensormedics)
")
33
Oxygen Consumption

34
Assumed: Older Patients: Tables, Formulae of LaFarge and Miettinen HR, age, sex, wide standard deviation Infants: Crude approximations 2-5 Kg: 10-14 mlO2/Kg 5-8 Kg: 7-11 mlO2/Kg ** Assumed oxygen consumption on O2 is NOT RECOMMENED

35
Flow Calculations: Limitations Errors in oxymetry Assumptions: O 2 Consumption PV O 2 saturation High flows (limits use of Fick’s method)
")
36
Sampling Sequence 1 ?2?2 3 1

37
What is a Significant Step-up? Shunt detection by oxymetry Chamber Sampled Minimum Difference Multiple Samples SVC-RA8.7%7% RA-RV5.2%4% RV -PA5.6%4%

38
Criteria for step-up

39
PVR Estimation Pulmonary artery mean pressure Pulmonary venous mean pressure Trans-pulmonary gradient PVR = Pulmonary blood flow Oxygen consumption PVO 2 contentPA O 2 Content

40
Determinants of Pulmonary Vascular Resistance (PVR) PVR PVR HypoxiaOxygen Hypercarbia/acidosisHypocarbia/Alkalosis HyperinflationNormal FRC AtelectasisNitric Oxide High hematocritLow hematocrit
 PVR PVR HypoxiaOxygen Hypercarbia/acidosisHypocarbia/Alkalosis HyperinflationNormal FRC AtelectasisNitric Oxide High hematocritLow hematocrit")
41
Left to Right Shunts: Conditions that increase PVR Lung infections Hypoventilation Upper airway obstruction Skeletal deformities of chest wall Deep sedation Chronic lung disease Underdeveloped lungs Pulmonary venous obstruction

42
Heart Lung Interactions: L - R Shunts with Hypoventilation Infants with Trisomy 21 VSD, Common AV canal and PDA Hypoventilation from upper airway obstruction is very common Resting elevation of PVR because of low PO 2 and high PCO 2 Problem exaggerated by sedation (during cath and echo)
")
43
Heart Lung Interactions: L-R Shunts with Hypoventilation Trisomy 21 Pierre-Robin Syndrome Neurogenic hypoventilation Skeletal deformities (Kyphoscoliosis) Assessment of operability and decision making can be very difficult
 Assessment of operability and decision making can be very difficult")
44
Special maneuvers in Cath lab PDA occlusion to assess operability Temporary occlusion of fenestrated Fontan to assess suitability of closure Temporary occlusion of venous collaterals (pop off channels) post Glenn operation
 post Glenn operation")
47
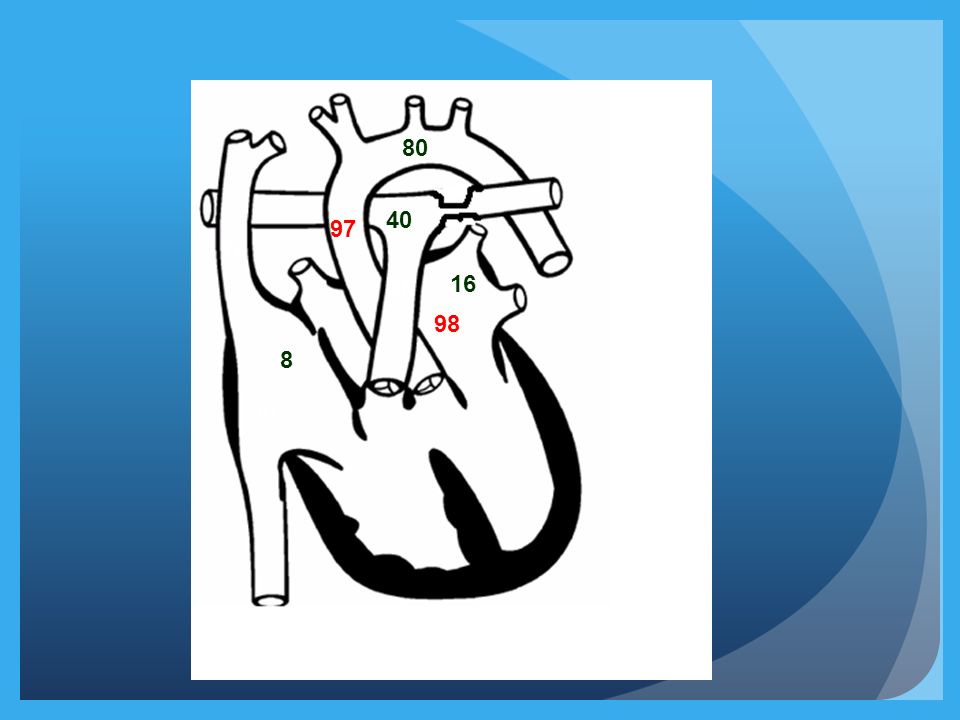
72 86 97 98 80 8 40 16 80Qp/Qs = 97-72 / 98-86 = 25/12 ~2:1 Cardiac Index: 3.2l/min/m 2 Qp = 6.4 l/min/m 2 PVRI =40-16/6.4; 24/6.4 = 3.75 wood units (mmHg/l.min.m2)
")
48
72 86 97 98 80 8 40 16 80
49
PVR assessment in the presence of asymmetric pulmonary blood flows Rt Lt 1/PVR = 1/pvr(rt) +1/pvr(lt)
 +1/pvr(lt)")
50
Some rules in interpreting hemodynamic data Pressures: Normal/high or low Gradients if any Trans-pulmonary gradient Diagnostic possibilities (keep this for the end )
")
51
Some rules in interpreting hemodynamic data Background Knowledge - All normal values Pressure recordings, principles and sources of error Principles of flow and resistance calculations, sources of error Principles of valve area calculations, sources of error

52
Some rules in interpreting hemodynamic data Look at one parameter at a time: Oxygen saturations followed by pressures SVC sats: Normal High or low Is there a significant step-up downstream at all levels Is there a step-down in the sats Quick calculation of Qp/Qs

53
SUMMARY Cardiac Cath in patients for CHD is a cumbersome process Inherent errors at all steps Every effort to minimize errors Rapid changes in hemodynamics during procedure should be recognized and efforts made to correct it Patient should be in as near physiological state as possible (chest infection, fever)
")
54
SUMMARY Need for angiography minimized with availability of alternate modes of imaging Calculations modules available in computer but important to allow resident to practice manual calculations Need to further develop techniques like MRI for flow calculation

55
Hemodynamic Tracings Rhythm on ECG Scale and paper speed Chamber: Atrial-venous / ventricular / arterial Identify waves (in atrial tracings), which is taller Numbers, normal or elevated Quality (only if abnormal, under-damped with overshoot, over-damped) Characteristics of the waves Respiratory variation, report end expiratory pressure Effect of ectopic if any Interpretation Diagnostic possibilities, there may be more than one!
, which is taller Numbers, normal or elevated Quality (only if abnormal, under-damped with overshoot, over-damped) Characteristics of the waves Respiratory variation, report end expiratory pressure Effect of ectopic if any Interpretation Diagnostic possibilities, there may be more than one!")
56
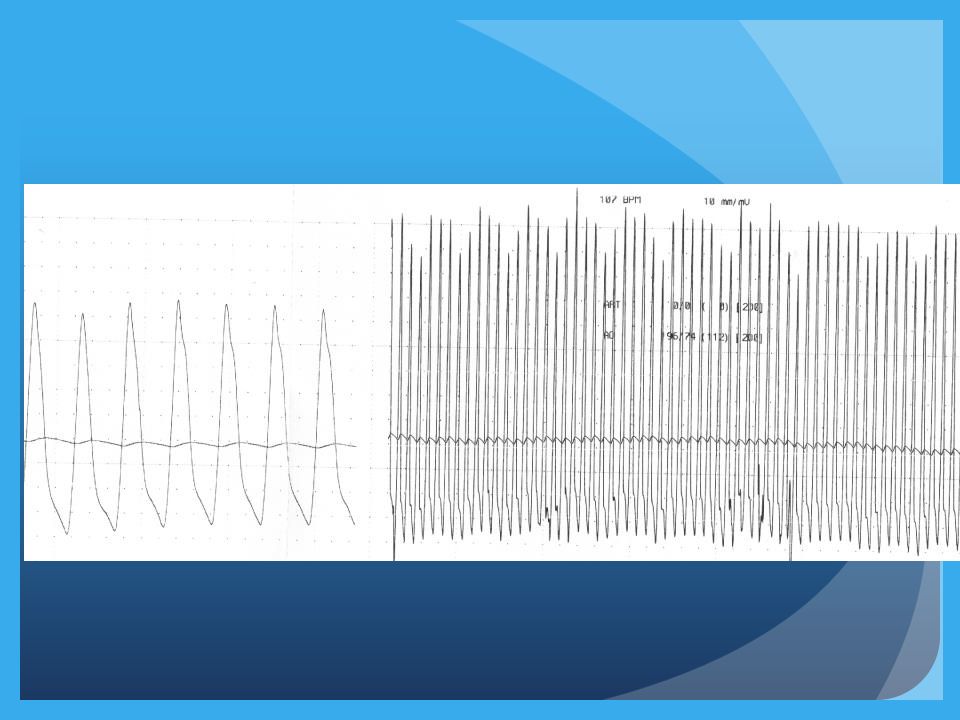
120 160 LV and aortic pressure tracings What is the diagnosis?

57
RV to RA pull back tracing

60
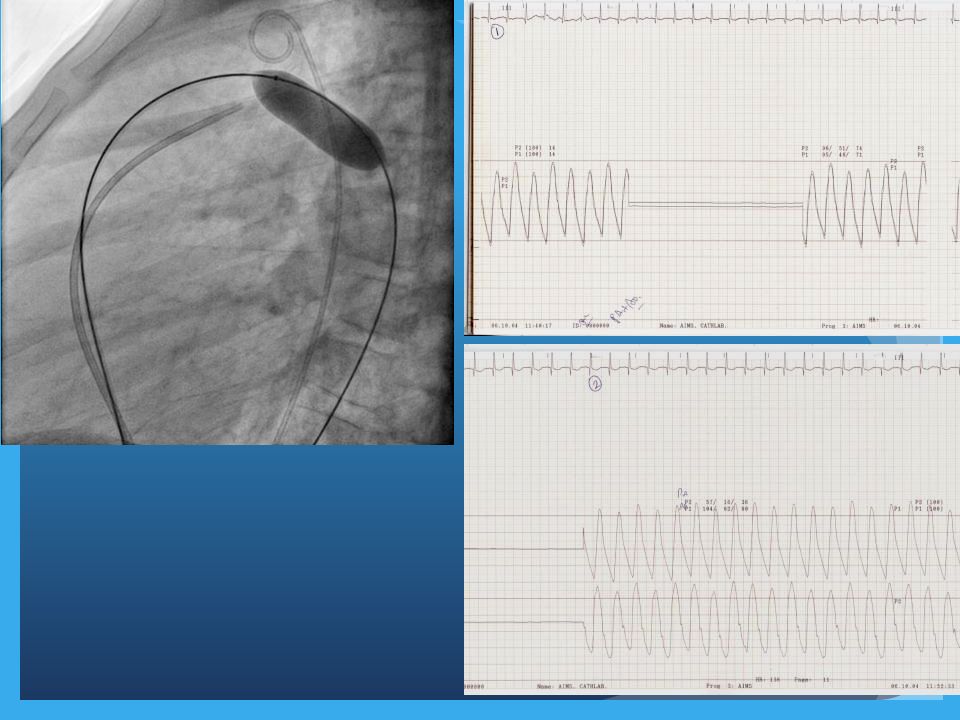
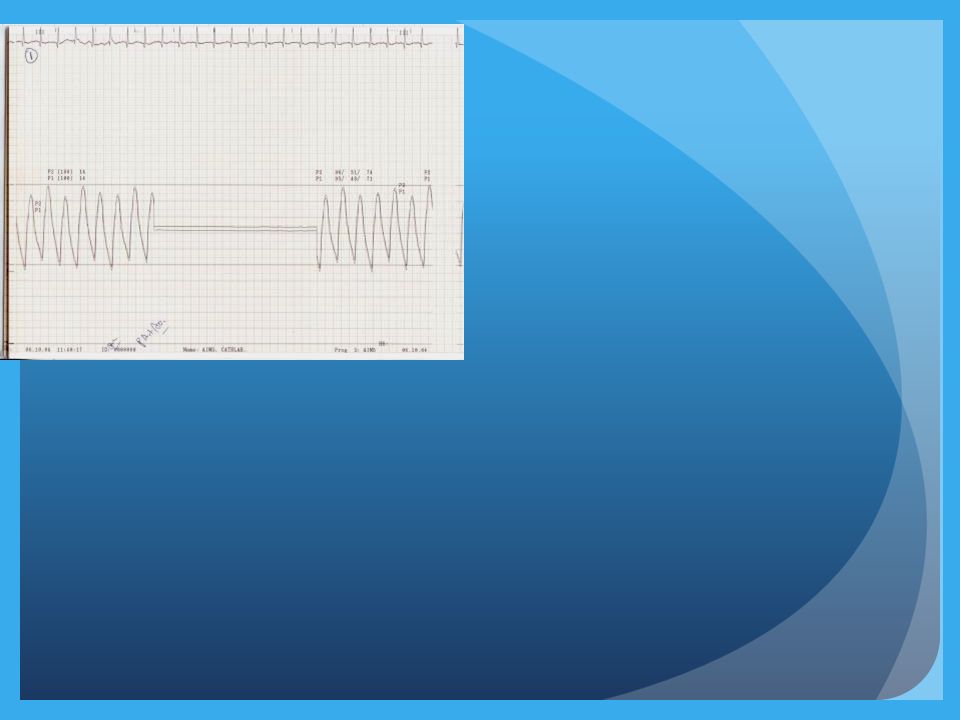
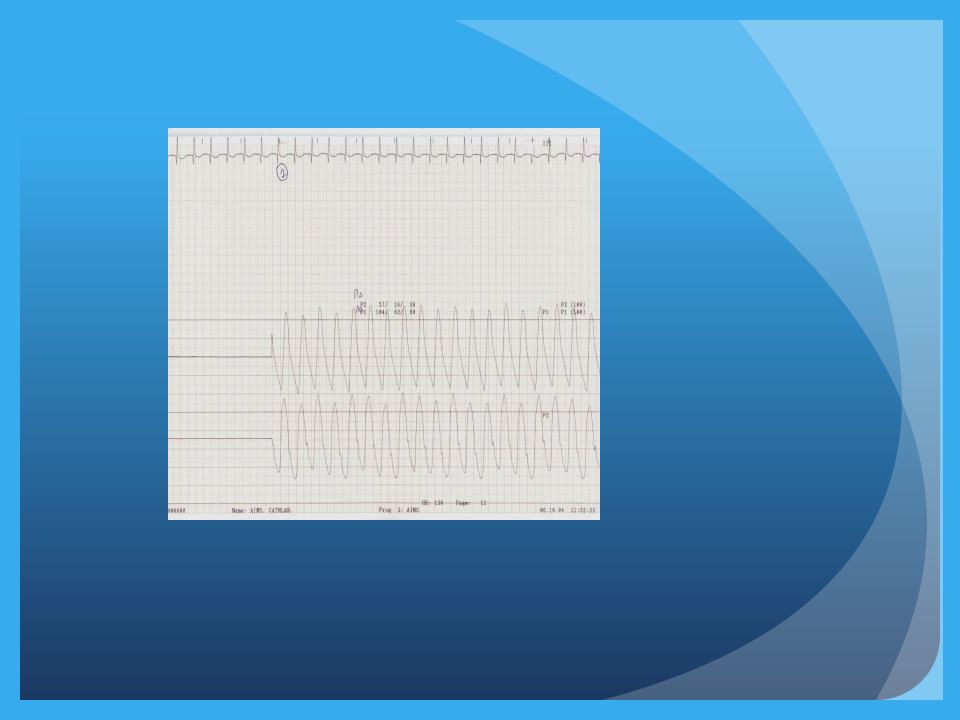
AO PA Balloon Occlusion Balloon deflation

61
Pre Proc

62
Post Proc

64
What sign is shown?

Similar presentations

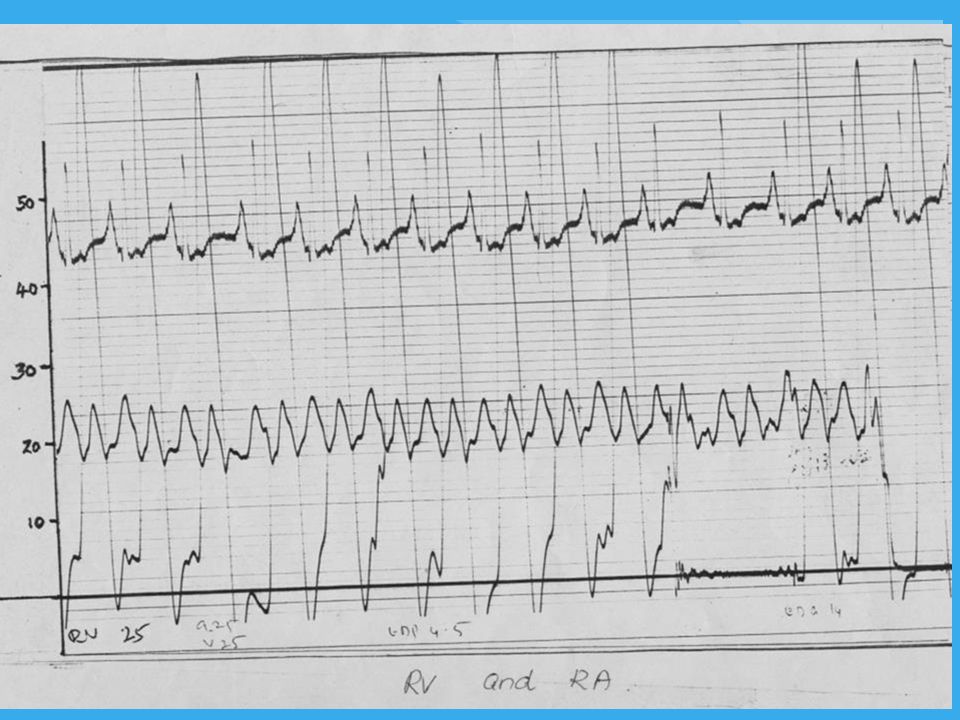


 RV:15-25 edp 0-5. PA:15-25; diast. 6-10, m = 10-15. PAW: a = 6-12, V = 8-14, m 6-10 (12) LA (PV): a=6-12, V=8-14,>")


