Download presentation
Presentation is loading. Please wait.

1
Lecture 6: Test-based Use case & Process Modeling December 7, 2014

2
Use Case Analysis Chapter 5

3
Key Ideas Use cases are a text-based method of describing and documenting complex processes Use cases add details to the requirements outlined in the requirement definition Systems analysts work with users to develop use cases System analysts develop process and data models later based on the use cases

4
5 - 4 Roles of Use Cases A use case is a set of activities that produce some output result Describes how the system reacts to an event that triggers the system Trigger -- event that causes the use case to be executed Event-driven modeling – everything in the system is a response to some triggering event

5
Role of Use Cases All possible responses to the event are documented Use cases are helpful when the situation is complicated

6
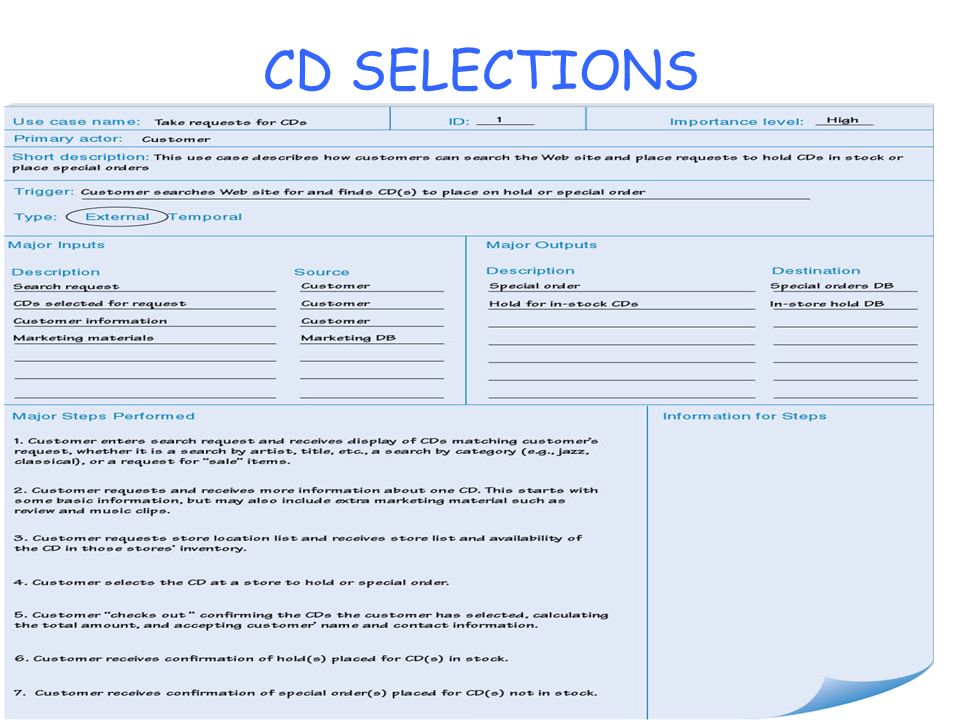
Elements of a Use Case Basic information – Name, number and brief description – Trigger – event that causes the use case to being External trigger – some from outside the system Temporal triggers – time-based occurrences – Viewpoint of the use cases should be consistent Major inputs and outputs – Sources and destinations – Goal is to be all inclusive Details – Steps performed and the data inputs and outputs

7
Sample Use Case

8
Building Use Cases

9
Process of Developing Use Cases Identify the major use cases Identify the major steps within each use case Identify elements within steps Confirm the use case Cycle through the above steps iteratively

10
Step 1: Identify the major use cases ActivitiesTypical Questions Asked Start a use case form for each use case If more than nine, group into packages Ask who, what, and where about the tasks and their inputs and outputs: What are the major tasks performed? What triggers this task? What tells you to perform this task? What information/forms/reports do you need to perform this task? Who gives you these information/forms/reports? What information/forms/reports does this produce and where do they go?

11
5 - 11 Sample List of Events-Actions Based on Requirements Definition

12
Step 2: Identify the major steps within each use case ActivitiesTypical Questions Asked For each use case, fill in the major steps needed to process the inputs and produce the outputs Ask how about each use case: How do you produce this report? How do you change the information on the report? How do you process forms? What tools do you use to do this step (e.g., on paper, by email, by phone)?
 .")
13
Step 3: Identify elements within steps ActivitiesTypical Questions Asked For each step, identify its triggers and its inputs and outputs Ask how about each step How does the person know when to perform this step? What forms/reports/data does this step produce? What forms/reports/data does this step need? What happens when this form/report/data is not available?

14
Step 4: Confirm the use case ActivitiesTypical Questions Asked For each use case, validate that it is correct and complete Ask the user to execute the process using the written steps in the use case – that is, have the user role-play the use case

15
CD SELECTIONS

17
5 - 17 CD SELECTIONS

18
Summary The Data Flow Diagram (DFD) is an essential tool for creating formal descriptions of business processes. Use cases record the input, transformation, and output of business processes and are the basis for process models. Eliciting use cases and modeling business processes are critically important skills for the systems analyst to master.

19
Process Modeling

20
Key Definitions Process model Illustrates the activities that are performed and how data moves among them (business processes) A process model is a graphical way of representing how a business system should operate. Data flow diagramming diagrams the business processes and the data that pass among them..

21
Key Definitions Logical process models describe processes without suggesting how they are conducted Physical process models provide information that is needed to build the system

22
DATA FLOW DIAGRAMS

23
PowerPoint Presentation for Dennis, Wixom, & Roth Systems Analysis and Design, 3rd Edition Copyright 2006 © John Wiley & Sons, Inc. All rights reserved. 6 - 23 Reading a DFD

24
How to read DFD Start reading diagrams from left to right, top to bottom.

26
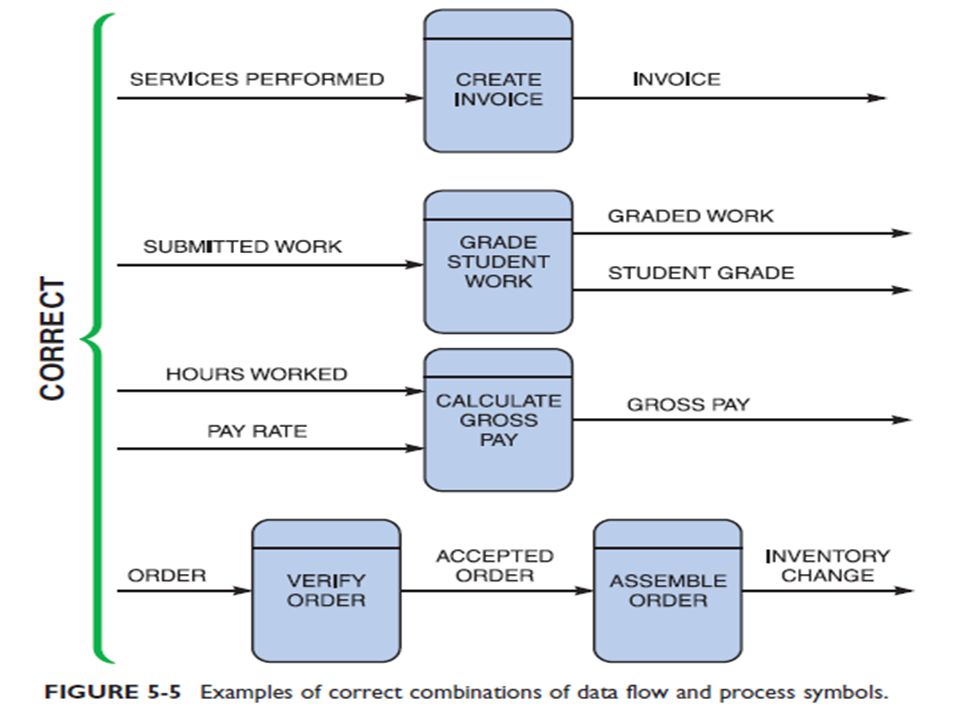
Elements of a DFD Process An activity or function performed for a specific business reason Manual or computerized Data flow A single piece of data or a logical collection of data Always starts or ends at a process

27
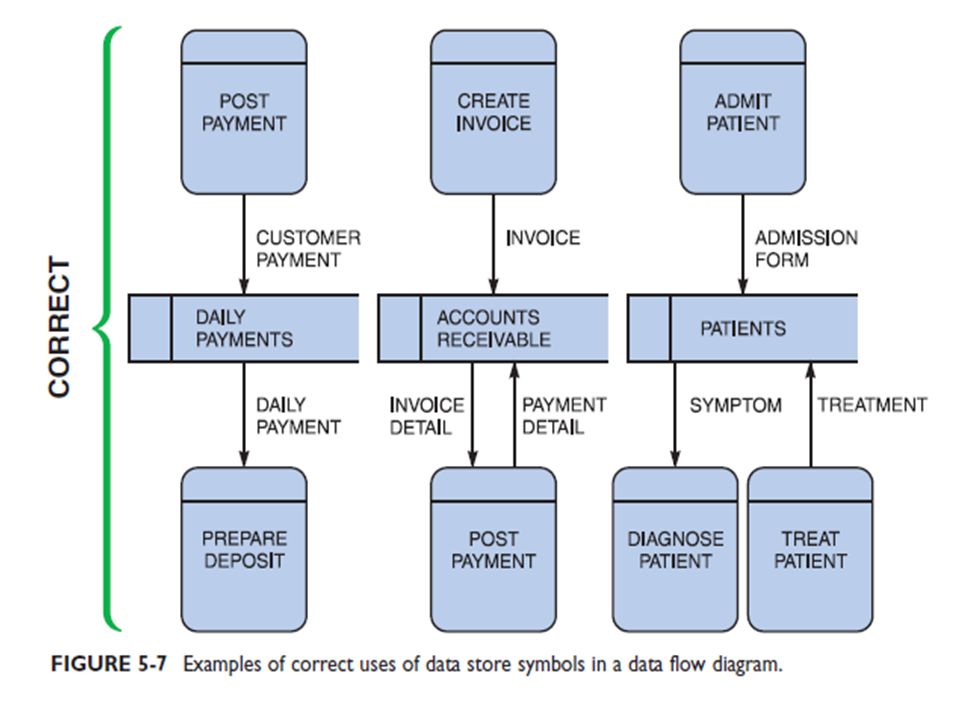
DFD Elements Data Store A collection of data that is stored in some way Data flowing out is retrieved from the data store Data flowing in updates or is added to the data store External entity A person, organization, or system that is external to the system but interacts with it.

28
PowerPoint Presentation for Dennis, Wixom, & Roth Systems Analysis and Design, 3rd Edition Copyright 2006 © John Wiley & Sons, Inc. All rights reserved. 6 - 28 Naming and Drawing DFD Elements ProcessData flowData storeExternal entity

29
6 - 29 Using a DFD to Define Business Processes Business processes are too complex to be shown on a single DFD Decomposition is the process of representing the system in a hierarchy of DFD diagrams Child diagrams show a portion of the parent diagram in greater detail

30
Key Definition Balancing involves insuring that information presented at one level of a DFD is accurately represented in the next level DFD.

31
Relationship among Levels of DFDs Context diagramLevel 0 diagramLevel 1 diagramLevel 2 diagram

32
Context Diagram First DFD in every business process -Shows the context into which the business process fits - Shows the overall business process as just one process (process 0) - Shows all the external entities that receive information from or contribute information to the system
 - Shows all the external entities that receive information from or contribute information to the system")
33
Level 0 Diagram * Shows all the major processes that comprise the overall system – the internal components of process 0 * Shows how the major processes are interrelated by data flows * Shows external entities and the major processes with which they interact * Adds data stores

34
Level 1 Diagrams * Generally, one level 1 diagram is created for every major process on the level 0 diagram * Shows all the internal processes that comprise a single process on the level 0 diagram * Shows how information moves from and to each of these processes * If a parent process is decomposed into, for example, three child processes, these three child processes wholly and completely make up the parent process

35
Level 2 Diagrams * Shows all processes that comprise a single process on the level 1 diagram * Shows how information moves from and to each of these processes * Level 2 diagrams may not be needed for all level 1 processes * Correctly numbering each process helps the user understand where the process fits into the overall system

36
Alternative Data Flows Where a process can produce different data flows given different conditions We show both data flows and use the process description to explain why they are alternatives Tip -- alternative data flows often accompany processes with IF statements

37
Process Descriptions * Text-based process descriptions provide more information about the process than the DFD alone * If the logic underlying the process is quite complex, more detail may be needed in the form of * Structured English * Decision trees * Decision tables

38
CREATING DATA FLOW DIAGRAMS

39
Integrating Scenario Descriptions * DFDs start with the use cases and requirements definition *Generally, the DFDs integrate the use cases Names of use cases become processes * Inputs and outputs become data flows “Small” data inputs and outputs are combined into a single flow

40
Steps in Building DFDs * Build the context diagram * Create DFD fragments for each use case * Organize DFD fragments into level 0 diagram * Decompose level 0 processes into level 1 diagrams as needed; decompose level 1 processes into level 2 diagrams as needed; etc. * Validate DFDs with user to ensure completeness and correctness

41
Creating the Context Diagram * Draw one process representing the entire system (process 0) * Find all inputs and outputs listed at the top of the use cases that come from or go to external entities; draw as data flows * Draw in external entities as the source or destination of the data flows
 * Find all inputs and outputs listed at the top of the use cases that come from or go to external entities; draw as data flows * Draw in external entities as the source or destination of the data flows")
42
A Context Diagram Example

43
Creating DFD Fragments * Each use case is converted into one DFD fragment * Number the process the same as the use case number * Change process name into verb phrase * Design the processes from the viewpoint of the organization running the system

44
Creating DFD Fragments * Add data flows to show use of data stores as sources and destinations of data * Layouts typically place processes in the center * inputs from the left * outputs to the right * stores beneath the processes

45
6 - 45 A DFD Fragment Example

46
Another Example

48
Creating the Level 0 Diagram * Combine the set of DFD fragments into one diagram * Generally move from top to bottom, left to right * Minimize crossed lines * Iterate as needed DFDs are often drawn many times before being finished, even with very experienced systems analysts

49
A Level 0 DFD Example

50
Creating Level 1 Diagrams (and Below) - Each use case is turned into its own DFD - Take the steps listed on the use case and depict each as a process on the level 1 DFD - Inputs and outputs listed on use case become data flows on DFD - Include sources and destinations of data flows to processes and stores within the DFD - May also include external entities for clarity
 - Each use case is turned into its own DFD - Take the steps listed on the use case and depict each as a process on the level 1 DFD - Inputs and outputs listed on use case become data flows on DFD - Include sources and destinations of data flows to processes and stores within the DFD - May also include external entities for clarity")
51
Creating Level 1 Diagrams (and Below) When to stop decomposing DFDs? Ideally, a DFD has at least three processes and no more than seven to nine.

52
Validating the DFD Syntax errors – diagram follows the rules Assure correct DFD structure For each DFD: Check each process for: A unique name: action verb phrase; number; description At least one input data flow At least one output data flow Output data flow names usually different than input data flow names Between 3 and 7 processes per DFD

53
Validating the DFD For each DFD: Check each data flow for: A unique name: noun; description Connects to at least one process Shown in only one direction (no two-headed arrows) A minimum number of crossed lines Check each data store for: A unique name: noun; description At least one input data flow At least one output data flow Check each external entity for: A unique name: noun; description At least one input or output data flow
 A minimum number of crossed lines Check each data store for: A unique name: noun; description At least one input data flow At least one output data flow Check each external entity for: A unique name: noun; description At least one input or output data flow")
54
Validating the DFD Across DFDs: Context Diagram: Every set of DFDs must have one Context Diagram Viewpoint: There is a consistent viewpoint for the entire set of DFDs Decomposition: Every process is wholly and complete described by the processes on its children DFDs Balance: Every data flow, data store, and external entity on a higher level DFD is shown on the lower level DFD that decomposes it No data stores or data flows appear on lower-lever DFDs that do not appear on their parent DFD

55
Validating the DFD Semantics errors – diagram conveys correct meaning Assure accuracy of DFD relative to actual/desired business processes To verify correct representation, use User walkthroughs Role-play processes Examine lowest level DFDs to ensure consistent decomposition Examine names carefully to ensure consistent use of terms

56
6 - 56 A Quick Review of Decomposition for CD Selections

57
PowerPoint Presentation for Dennis, Wixom, & Roth Systems Analysis and Design, 3rd Edition Copyright 2006 © John Wiley & Sons, Inc. All rights reserved. 6 - 57 Context Diagram for CD Selections Internet Sales System

58
PowerPoint Presentation for Dennis, Wixom, & Roth Systems Analysis and Design, 3rd Edition Copyright 2006 © John Wiley & Sons, Inc. All rights reserved. 6 - 58 Level 0 DFD for CD Selections Internet System

59
PowerPoint Presentation for Dennis, Wixom, & Roth Systems Analysis and Design, 3rd Edition Copyright 2006 © John Wiley & Sons, Inc. All rights reserved. 6 - 59 Level 1 DFD for CD Selections Process 1: Take Requests

65
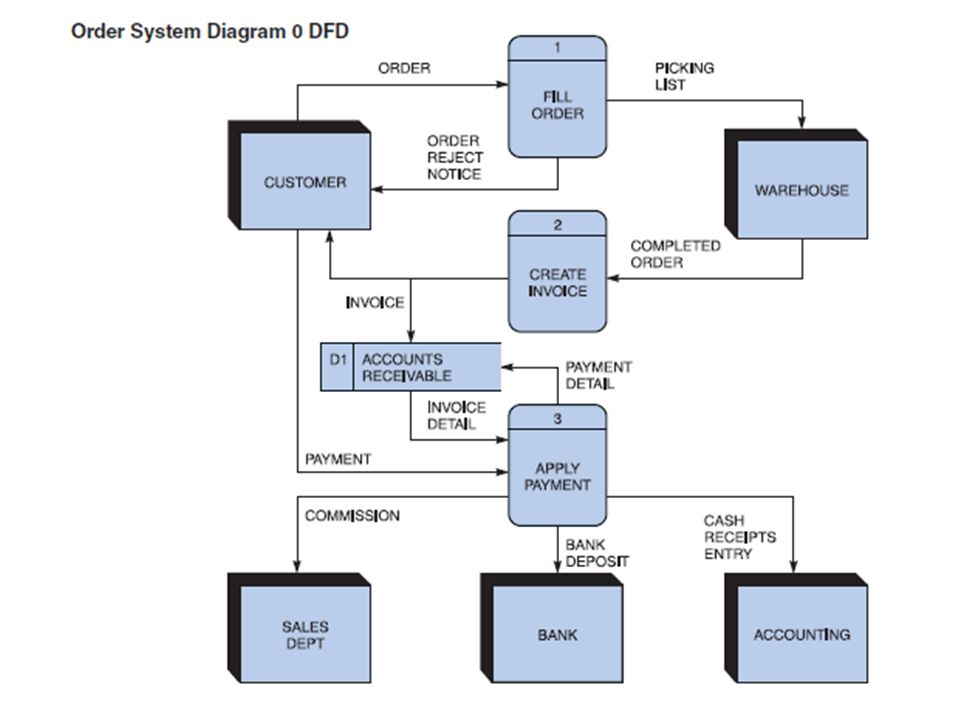
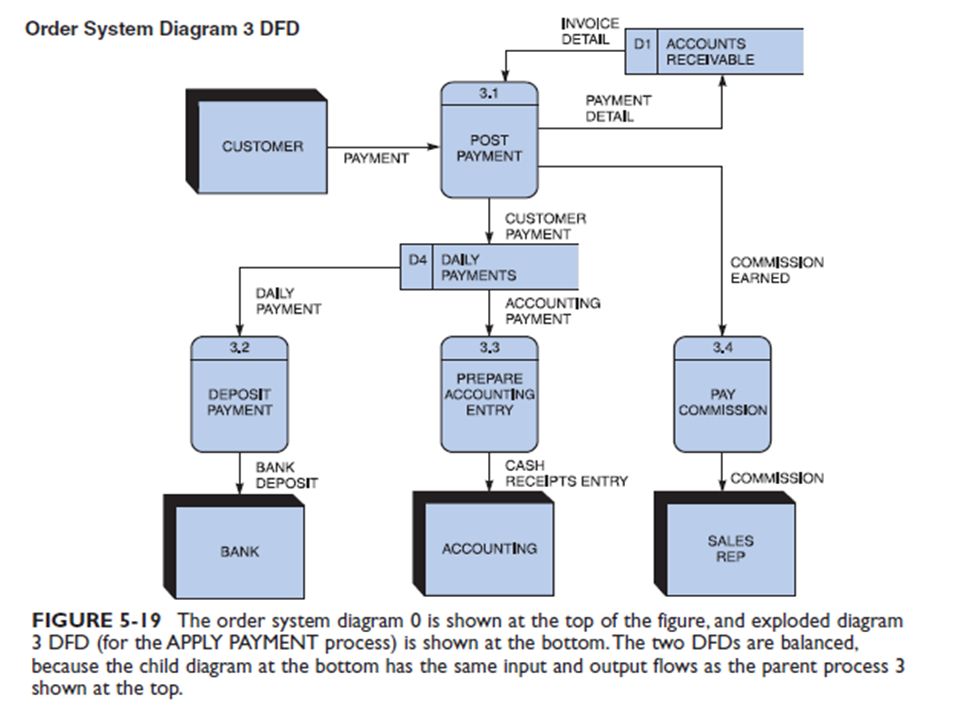
BALANCING EXAMPLES Balancing ensures that the input and output data flows of the parent DFD are maintained on the child DFD. The order system diagram 0 is shown at the top of the figure, and the exploded diagram 3 DFD is shown at the bottom. The two DFDs are balanced, because the child diagram at the bottom has the same input and output flows as the parent process 3 shown at the top. To verify the balancing, notice that the parent process 3, APPLY PAYMENT, has one incoming data flow from an external entity, and three outgoing data flows to external entities. Now examine the child DFD, which is diagram 3. Now, ignore the internal data flows and count the data flows to and from external entities. You will see that the three processes maintain the same one incoming and three outgoing data flows as the parent process.

68
Important Announcements Grading for the course: Final Exam: 70 points Year Work: 30 points - 10 Midterm, 2 Attendance, 12 assignments, 6 presentation & Discussion Implementation 3 extra credit

Similar presentations


 DATA FLOW DIAGRAMs.>")


