Download presentation
Presentation is loading. Please wait.

1
Chapter 52 Population Ecology

2
Characteristic of Populations Population: group of individuals of a single species that simultaneously occupy the same general area – rely on the same resources, influenced by similar environmental factors, and have a high likelihood of breeding with and interacting with one another Shaped by interactions between individuals and their environments, and natural selection can modify these characteristics

3
Density and Spacing At any point in time, every population has geographic boundaries and a population size Begin by studying a population by defining boundaries appropriate to the organisms – May be nature ones, such as a specific island, or arbitrarily defined, such as oak trees in Minnesota Population density is the number of individuals per unit of area or volume Dispersion is the pattern of spacing among individuals within the geographic boundaries

4
Measuring Density Rarely, you can count all individuals inside the boundaries Use a variety of sampling techniques to estimate densities and total population sizes – More sample plots = more reliable data Mark-recapture method: traps are placed within the boundaries of the study area, and captured animals are marked with tags, collars, bands, or dye spots and then immediately released. After a certain time (enough for the marked animals to mix with unmarked animals) traps are set again. The proportion of marked animals is assumed equivalent to the proportion of marked animals in the total population.
 traps are set again. The proportion of marked animals is assumed equivalent to the proportion of marked animals in the total population..")
5
Measuring Density Number of recaptures in second catch Total number in second catch = Number marked in first catch Total population N

6
Measuring Density Thus, if there have been no births, deaths, immigrations, or emigration, the following is an estimate of N N = Number marked in first catch X Total number in second catch / number of recaptures in second catch

7
Measuring Density Example: – 50 snowshoe hares are captured in traps, marked with ear tags, and released – Two weeks later, 100 hares are captured, and 10 have already been marked (recaptures = 10%) – Since 50 hares were originally marked, the entire population would be about 500 hares
 – Since 50 hares were originally marked, the entire population would be about 500 hares")
8
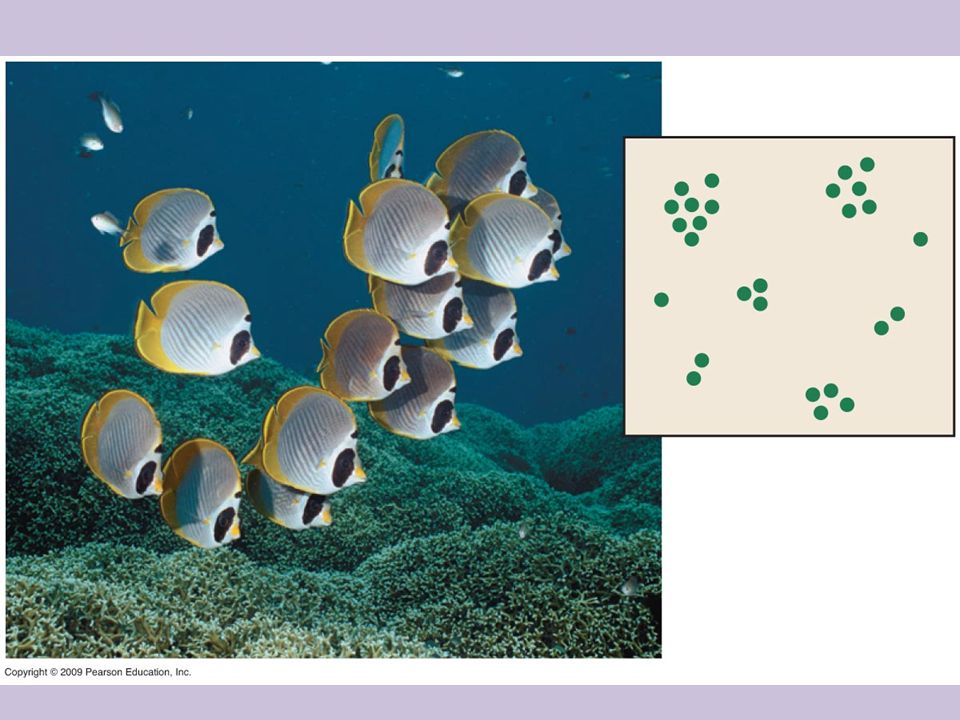
Patterns of Dispersion Clumped: most common type, with individuals aggregated in patches – Plants may be clumped in areas where soil conditions and other environmental factors favor germination and growth – Herd animals – Used during mating seasons – “Safety in Numbers”

10
Patterns of Dispersion Uniform: evenly spaced distribution – May result from direct interactions between individuals of a population – Tendency toward uniform spacing in plants may be due to shading and competition for water and minerals Some plants also secrete chemicals that inhibit growth and germination of nearby plants Animals that are territorial and aggressive

12
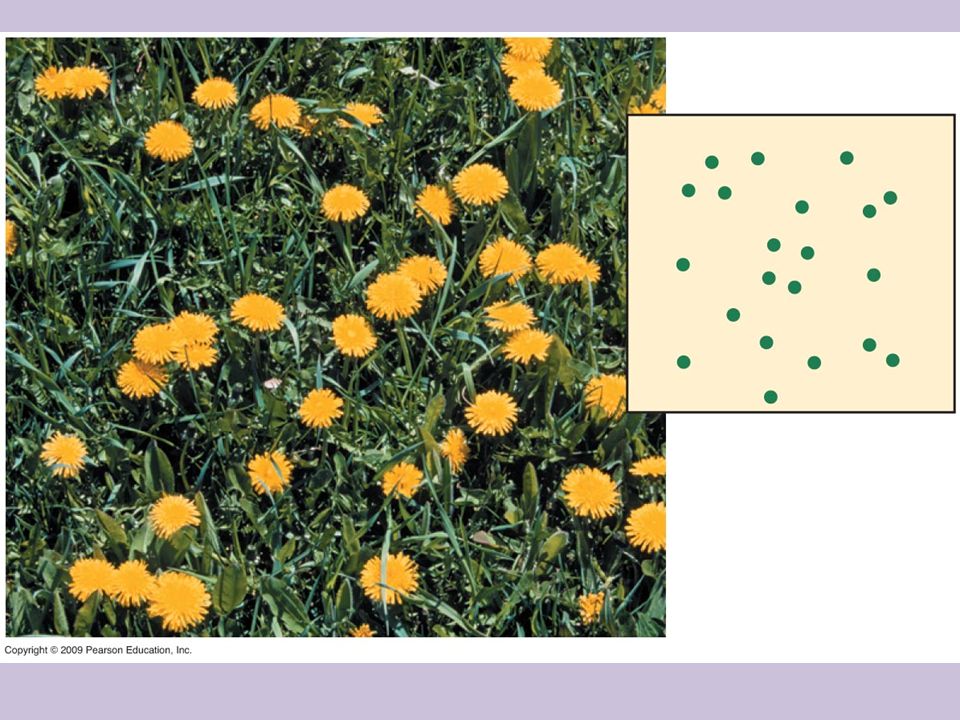
Patterns of Dispersion Random: “unpredictable dispersion” occurs in the absence of strong attractions or repulsions among individuals of the population – Position is independent of each other – Trees in a forest are sometimes randomly distributed – Not very common at all

14
Demography Changes in population size reflect rates of processes that add individuals to the population and eliminate some from it Additions are birth and immigration Eliminations are deaths and emigration Demography: study of the vital statistics that affect population size

15
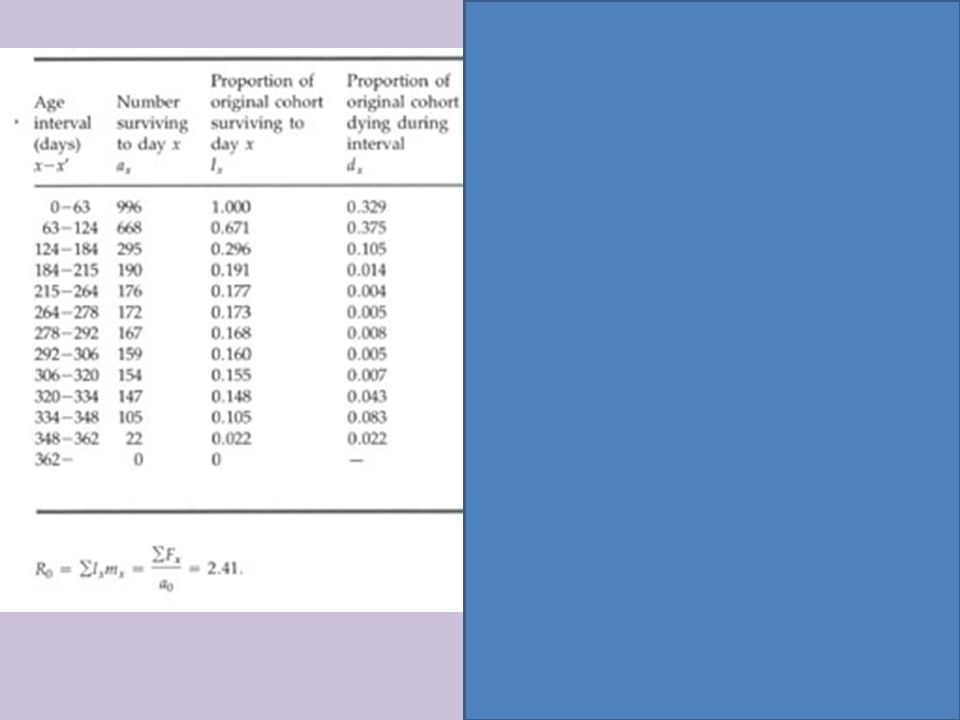
Life Tables and Survivorship Curves Began when the first life insurance policies were started Life table: an age-specific summary of the survivorship of a population – Construct by following the fate of a cohort, a group of individuals the same age, from birth until all are dead

17
Life Tables and Survivorship Curves Survivorship Curves: plot of the proportion or numbers in a cohort still alive at each age – Can be classified into 3 different types: Type 1: relatively flat at the start, reflecting low death rates during early and middle life, then drops steeply as death rates increase among older age-groups – Humans (parental care and few offspring) Case 3: curve drops sharply at the left of the graph, reflecting high mortality in youth, but then flattens out, and declines as it reaches older age-groups – Very large numbers of offspring, provide little or no care – Ex: Oyster- releases millions of eggs but only few survive, those that do survive tend to live for a long time Case 2: intermediate, constant death span over time – Annual plants, some lizard and rodent species
 Case 3: curve drops sharply at the left of the graph, reflecting high mortality in youth, but then flattens out, and declines as it reaches older age-groups – Very large numbers of offspring, provide little or no care – Ex: Oyster- releases millions of eggs but only few survive, those that do survive tend to live for a long time Case 2: intermediate, constant death span over time – Annual plants, some lizard and rodent species")
19
Life Tables and Survivorship Curves Some species are a combination of curves: – Birds: mortality is highest among the young, but fairly constant in adults – Invertebrates, such as crabs, have a stair-stepped curve with brief periods of increased mortality during molts Greater vulnerability to predators, and physiological problems

20
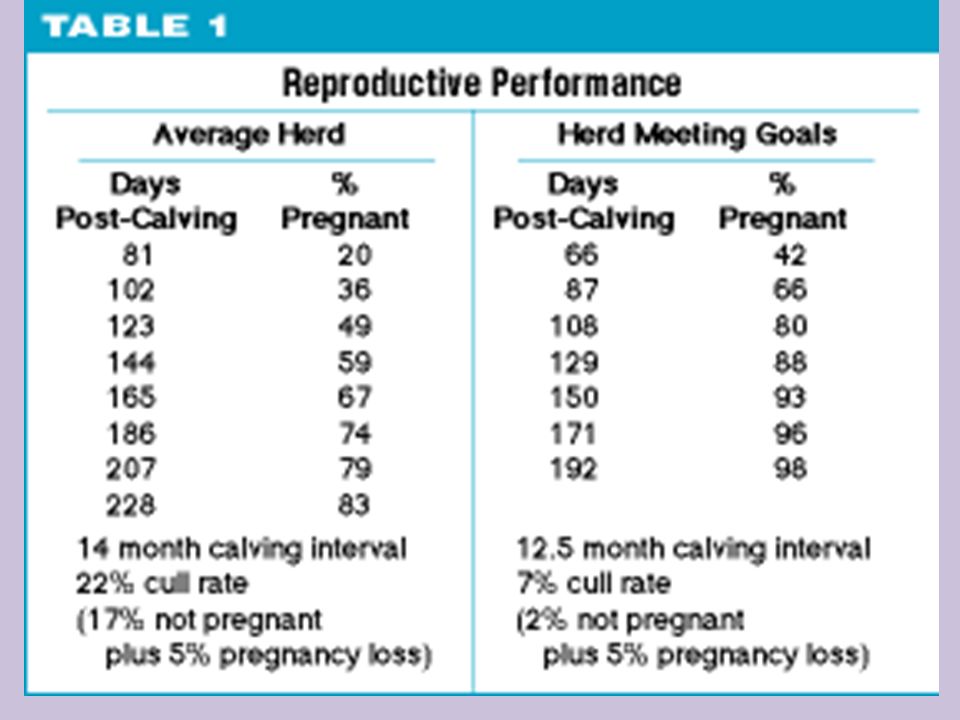
Reproductive Rates Ignore males and concentrate on females View populations in terms of females giving birth to new females Reproductive Table: fertility schedule, is an age-specific summary of the reproductive rates in a population – Measure the reproductive rates in a cohort from birth to death

22
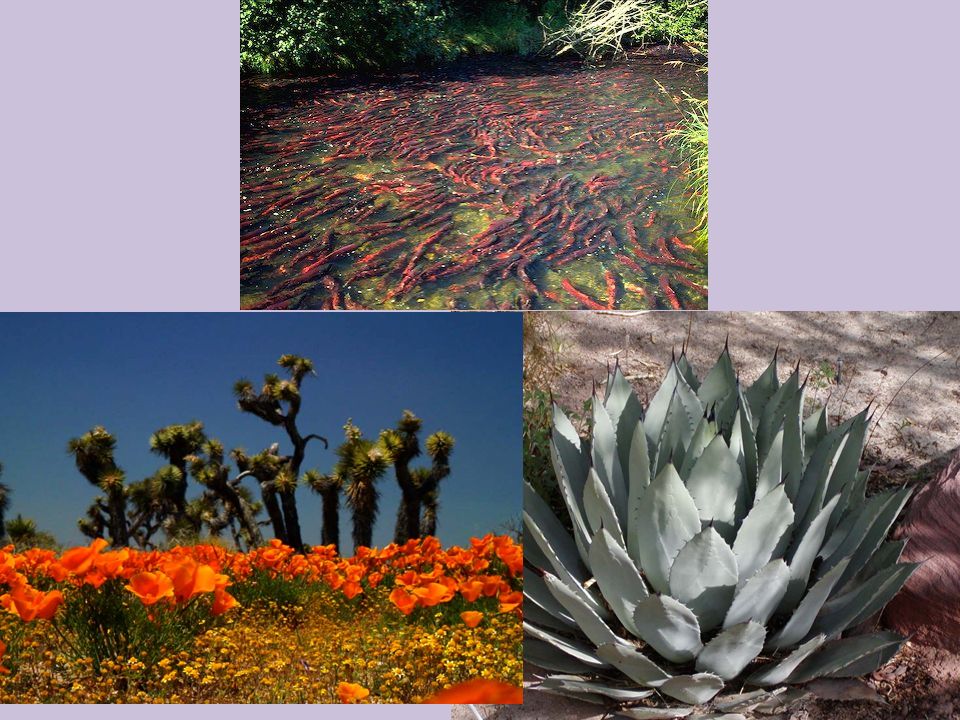
Life Histories Life history: traits that affect an organisms’ schedule of reproduction and survival Big-bang reproduction: adults have a single reproductive opportunity to produce large numbers of offspring – Ex: salmon, agave, desert wildflowers – Also called semelparity Semel = once Parito = to beget

24
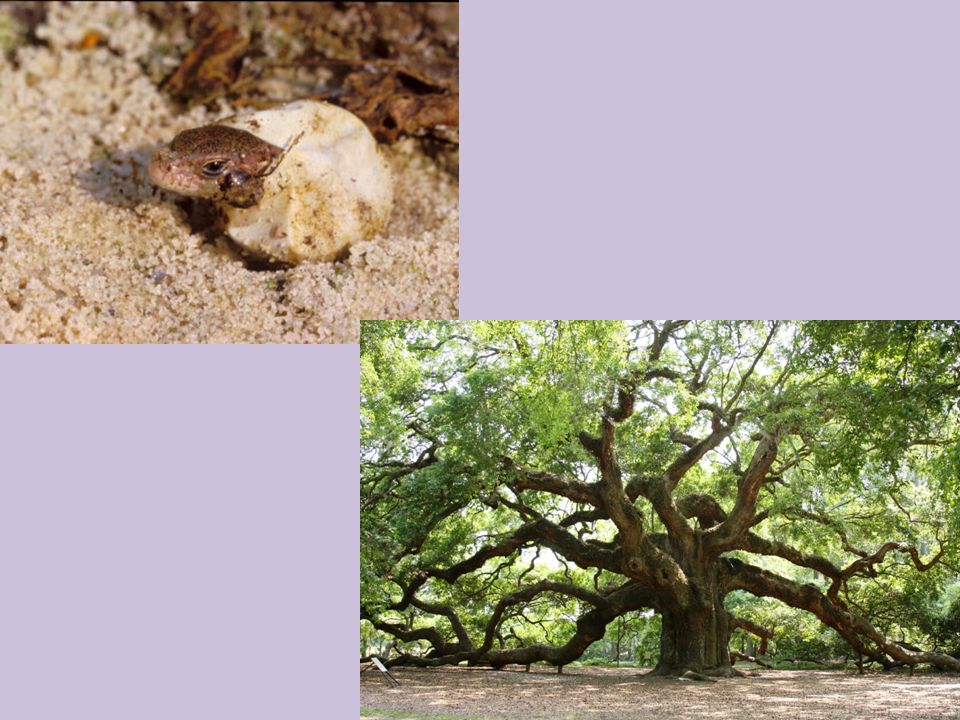
Life Histories Repeated reproduction: adults produce large numbers of offspring for many years – Lizards that produce two eggs a year for 20 years – Oaks that produce vast amounts of seeds for a century or more – Also called iteroparity Itero = repeat

26
Life Histories What factors influence which life history a population will have? – If the offspring’s chance of survival is poor or inconsistent, repeated production will be favored – If you need high reproductive rates, semelparitous organisms typically produce two to five times as many offspring as closely related species that reproduce often

27
Trade-Offs Studies show that animals that reproduce and have many offspring end up surviving less than those who don’t reproduce as many Three basic decisions must be made: – When to begin reproducing – How often to breed – How many offspring to produce during each reproductive episode

28
Population Growth Change in population size = Births – Deaths N = population size t = time (appropriate to life span or generation time of species) – ∆N / ∆t = B – D b = per capita birth rate – If a population of 1,000 has 34 births/ year, b = 0.034 – B = bN
 – ∆N / ∆t = B – D b = per capita birth rate – If a population of 1,000 has 34 births/ year, b = – B = bN")
29
Population Growth ∆N /∆t = bN – dN r = difference in per capita birth and death rates – r = b – d – Will tell us if the population is growing or declining Zero population growth (ZPG): when r = 0 – Deaths and births equal one another ∆N / ∆t = rN dN / dt = r N (for instantaneous growth rate) – d doesn’t mean death rate here, it is a small change
: when r = 0 – Deaths and births equal one another ∆N / ∆t = rN dN / dt = r N (for instantaneous growth rate) – d doesn’t mean death rate here, it is a small change")
30
Population Growth Exponential Growth: geometric population growth – Would assume the maximum growth rate, intrinsic rate of increase, denoted as r max – dN / dt = r max N

32
Population Growth As a population increases, its density may influence the ability of individuals to harvest sufficient resources for maintenance, growth, and reproduction Carrying Capacity: the maximum population size that a particular environment can support at a particular time with no degradation to the habitat – K – Energy limitation is one of the most significant determinants of carrying capacity Others are shelter, refuges from predators, soil nutrients, water, suitable nesting and roosting sites

33
Population Growth Logistic population growth: incorporates the effect of population density on the per capita of increase, allowing this rate to vary from maximum at low population size to zero as carrying capacity is reached – When they are well below K, population increases drastically and slows down when it reaches K

34
Logistic Growth Equations K – N = how many additional individuals the environment can support (K-N) / K tells us what fraction of K is still available for growth dN/dt = r max N (K-N /K) Produces a sigmoid shaped curve
 / K tells us what fraction of K is still available for growth dN/dt = r max N (K-N /K) Produces a sigmoid shaped curve")
36
How is it Really? Can only be “logistical” if under laboratory settings Model incorporates ideas that even at low population levels, each individual added to the population has the same negative effect on population growth rate – Some have the Allee effect, where individuals may have a more difficult time surviving or reproducing if the population is too small

37
How is it Really? Model also assumes that populations adjust instantaneously and approach carrying capacity smoothly – There is a lag time before the negative effects of an increasing population are realized Can cause a population to overshoot their K, and then drop below it Logistic model is a useful starting point for thinking about how populations grow – Still useful in conservation biology and pest control because it gives an idea about growth rates

38
Population Growth and Life Histories At a high population density, selection favors adaptations that enable organisms to survive and reproduce with few resources – Competitive ability and maximum efficiency of resource utilization is favored in populations that are at or near their K At a low density, increased fecundity, and earlier maturity would be selected for

39
Population Growth and Life Histories K-selection: selection for life history traits that are sensitive to population density – Density-dependent selection – Maximize population size and operates in populations living at a density near K r-selection: selection for life history traits that maximize reproductive success in uncrowded environments – Density-independent selection – Maximize r, the rate of increase, and occurs in variable environments where population densities fluctuate below K or in open habitats where they face little competition

40
Population Limiting Factors Why do all populations eventually stop increasing? What environmental factors stop a population from growing? Why is the population density of a particular species greater in some habitats than others?

41
Population Limiting Factors Must find out how the rates of birth, death, immigration, and emigration change as density rises Density-dependent: death rate rises as a population density rises, and birth rate falls with rising density – Negative feedback Density-independent: birth and death rate that does not change when population density increases

42
Population Limiting Factors Negative Feedback: – Resource limitation in crowded populations Reduce seed production in plants As bird density increases, females lay fewer eggs – Predation Target some because their densities are large – Accumulation of toxic wastes Why wine is only 13% alcohol, because yeast die off in a higher concentration – Disease – Intrinsic Factors Ex: Woodchucks- stress leads to atrophy of sexual organs, and increased aggression…

44
Population Limiting Factors Some populations have regular boom-and- bust cycles – Ex: Snowshoe hare and lynx Lynx numbers reflect hares, but hares fluctuate greatly Cycles may be caused by food shortage during winter Cycles may be due to predator-prey interactions Cycles may be due to a combination of the two

46
Population Limiting Factors – Why the cycles? Stress resulting from high population density may alter hormonal balance, which could reduce fertility and increase aggressiveness. – Stress could also be from unsuccessful predator attacks, having to search for food, or parasites that are found in high densities Result from a time lag in the response of predators to rising prey Availability of prey/food

47
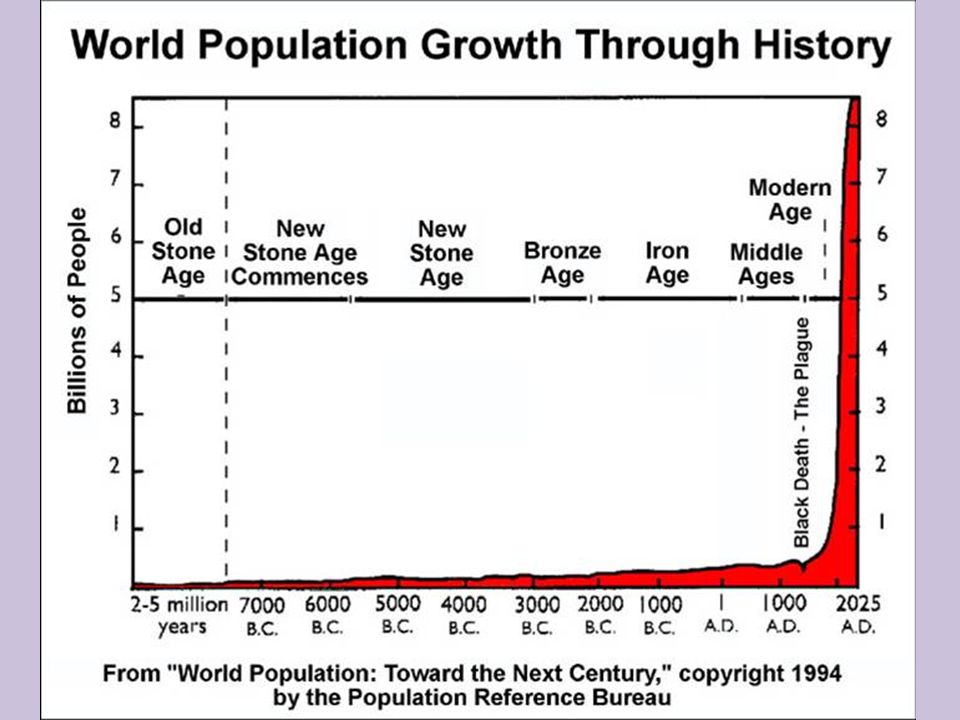
Human Population Growth Explosive growth of human population, and massive consumption of the planet’s resources by developing nations, is the primary cause of severe environmental problems and loss of species Human growth has been exponential for three centuries

49
Human Population Growth Population increases by about 80 million each year – 214,000 a day It says in the book “Equivalent to adding a city the size of Amarillo, Texas every day” Demographic transition: a shift from zero population growth in which birth rates and death rates are high to zero population growth characterized by low birth and death rates

50
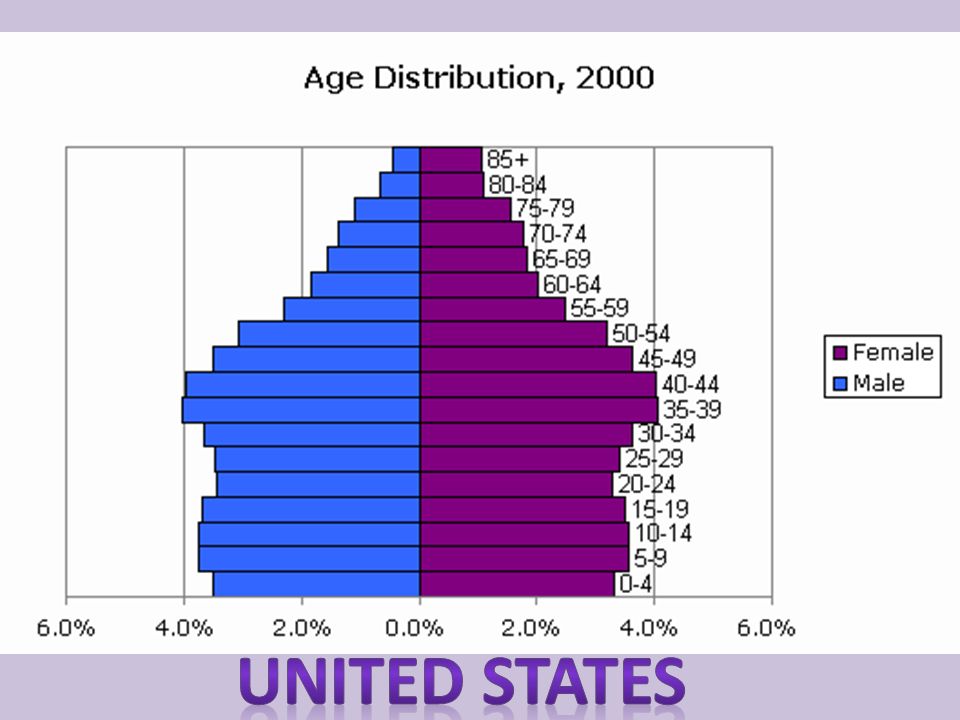
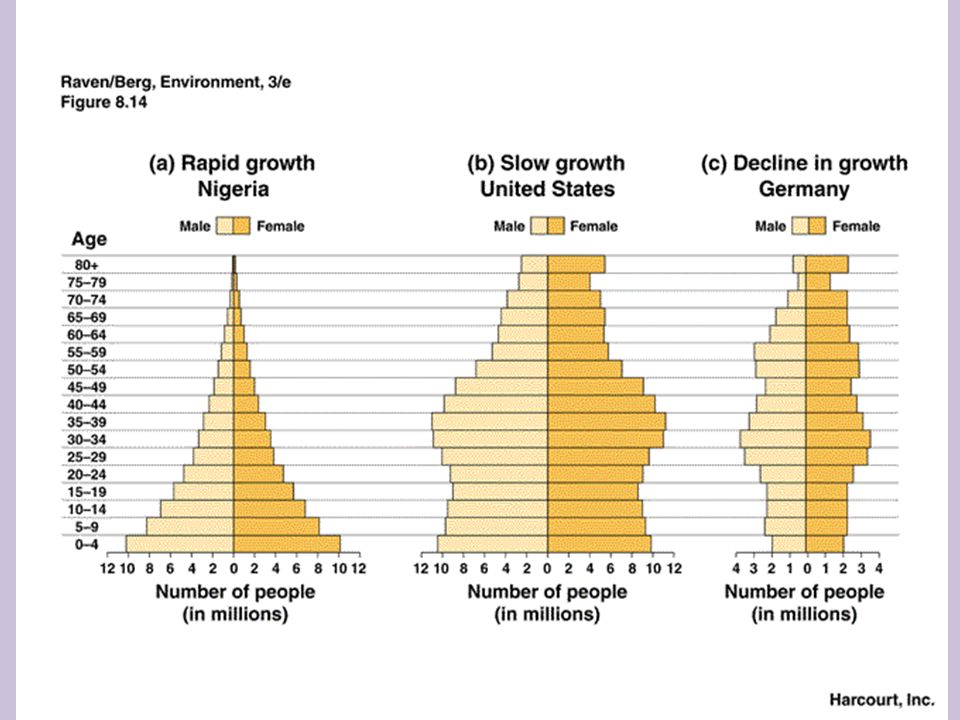
Human Population Growth In developed countries, populations are near equilibrium, with reproductive rates near the replacement level (2.1 children per female) Age structure: relative number of individuals of each age group – Stable ones indicate stable population size – Kenya has a “bottom- heavy” structure that favors young, and they will grow up and reproduce and add to the population immensely – US is steady except for a bulge where the “baby- boomers” are – Can be used to predict future social concerns
 Age structure: relative number of individuals of each age group – Stable ones indicate stable population size – Kenya has a bottom- heavy structure that favors young, and they will grow up and reproduce and add to the population immensely – US is steady except for a bulge where the baby- boomers are – Can be used to predict future social concerns")
Similar presentations


 Ecologists define a population as a single- species group of individuals that use common.>")


 Sketch an exponential population growth curve and a logistic population growth curve. 2.What is an ecological footprint? 3.What.>")


