Download presentation
Presentation is loading. Please wait.

1
Can you teach a long-term benthic monitoring program new tricks? Marc Vayssières, Karen Gehrts and Cindy Messer - CA Dept. of Water Resources Assessment and redesign to address different scales.

2
Outline Our monitoring program Programmatic Review Questions Two Special Studies: –Large scale representativity –Small scale representativity Proposed new sampling design

3
Environmental Monitoring Program Mandated by Water Right Decision compliance with water quality standards document effects of diversions and flow manipulation Environmental Water Quality, Phytoplankton, Zooplankton, Benthic macro- invertebrates Part of the Interagency Ecological Program Joint effort of CA Dept. of Water Resources and US Bureau of Reclamation. With assistance from CA Dept. of Fish and Game and US Geological Survey.

4
Benthic Monitoring Program Methods –Ponar dredge (0.05 m2) –4 grabs at each site –Washed over No.30 steel mesh (0.6 mm) –Preserved in formalin –Taxonomy to species level
 –4 grabs at each site –Washed over No.30 steel mesh (0.6 mm) –Preserved in formalin –Taxonomy to species level")
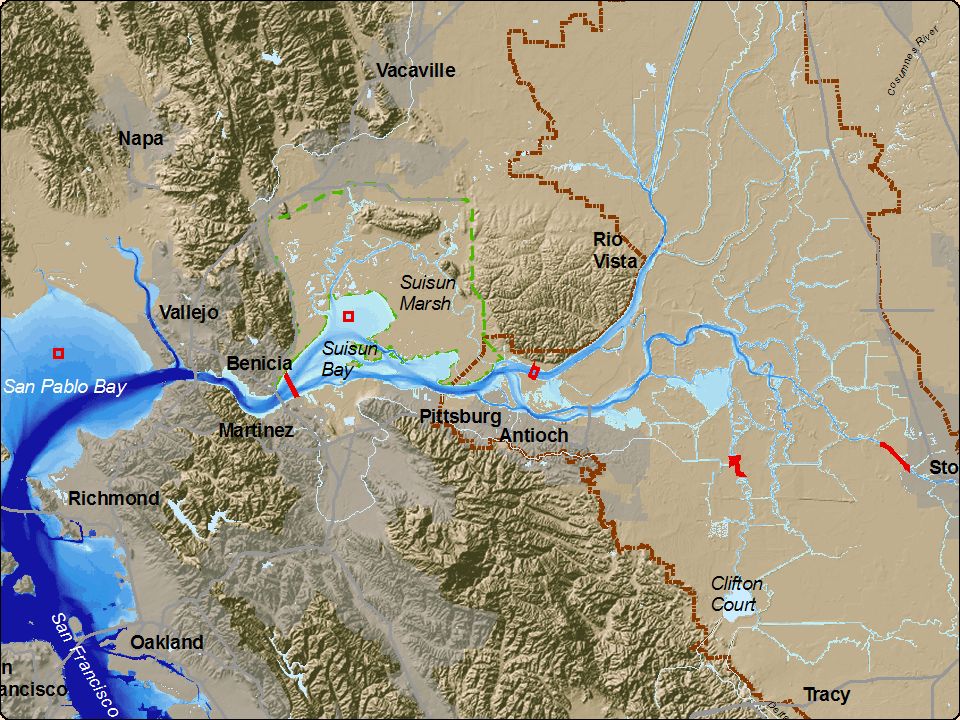
5
Benthic Monitoring Program Geographic extent San Francisco Estuary Bay Delta Confluence

6
Benthic Monitoring Program Began in 1975, 3 phases: –1975-80 : 49 sites, once or twice per year –1980-95 : 9 sites, monthly –1996-06 : 10 sites, monthly Benthic database (1975 to present): –390 species of macro-invertebrates –9500 grabs
: –390 species of macro-invertebrates –9500 grabs")
9
Ordination of the Four Long Term Sites (1975-2004)
")
10
Programmatic Review IEP’s Science Advisory Group (2001-2002) –Questioned the large scale and small scale representativity of sampling design –recommended to research and propose a new sampling design over the next three years Decisions: –Curtailed sampling from monthly to quarterly (2004-05) –Used resources to conduct 2 special studies Upper-Estuary wide survey (May 2003) Local neighborhoods survey (April-July 2005)
 –Questioned the large scale and small scale representativity of sampling design –recommended to research and propose a new sampling design over the next three years Decisions: –Curtailed sampling from monthly to quarterly ( ) –Used resources to conduct 2 special studies Upper-Estuary wide survey (May 2003) Local neighborhoods survey (April-July 2005)")
11
Study 1: Large Scale Representativity Question: –Is the EMP missing any benthic community in the Upper SF Estuary?

13
Study 1: Large Scale Representativity Data: –153 grabs from 153 locations during the “Benthic Boogie” (with USGS) in May; + 39 in October. –40 grabs from 10 regular monitoring sites each time Methods –Bray-Curtis similarity on square root of species abundance –Ordination (Non metric multi dimensional scaling) –Clustering (Partitioning Around Medoids) –Indicator and discriminating species
 –Clustering (Partitioning Around Medoids) –Indicator and discriminating species.")
17
Findings: –The four grabs taken at monitoring sites were clustered together in the analyses –2 of the 10 assemblages were without a regular monitoring site. Both are depauperate. –Assemblages in fall survey consistent with spring, but some sites changed. Study 1: Large Scale Representativity

18
For new design: –Sampling at many more locations is desirable: Large parts of the Delta need to be better represented. Some assemblages depend on local habitat features. Study 1: Large Scale Representativity

19
Study 2: Small Scale Representativity Question: –Are EMP’s monitoring sites representative of the benthic community in their neighborhoods?

22
Study 2: Small Scale Representativity Data: –30 grabs taken in 64ha neighborhoods of 6 of EMP regular sites in April and in July –4 regular monitoring grabs at each site Methods –Generalized Random Tessellation Stratified design in each neighborhood –Bray-Curtis similarity on sqrt of species abundance –Ordination (Non metric multi dimensional scaling)
")
23
D7 Grizzly Bay

24
D4 Sacramento River near confluence

25
D28A Old River near Rock slough

26
San Joaquin River near Stockton

29
Findings: –Representativity of the 4 regular grabs is: Excellent in shallow embayments. Lowest in large flowing channels. Intermediary in smaller, lower flow rivers. –Representativity tied to bathymetry, hydrology, substrate and amount of edges. –Current monitoring sites were chosen for their species richness and abundance. Study 2: Small Scale Representativity

30
For new design: –Remove bias by sampling random sites –Stratification is necessary in selecting random locations in the Upper Estuary. Embayments with the most surface area have the least variability, … Study 2: Small Scale Representativity

31
Proposed Sampling Design Keep sampling monthly at 5 or 6 sites: –Seasonal patterns, long time series, “sentinel sites” Add 2 spatially extensive surveys / year –spring and fall. –25 sites visited each survey –225 sites visited twice (and new set each year) –Randomly chosen using Generalized Random Tessellation Stratified (GRTS) survey design (Olsen R.A. & Stevens D.L.)
 –Randomly chosen using Generalized Random Tessellation Stratified (GRTS) survey design (Olsen R.A. & Stevens D.L.).")
32
Proposed Sampling Design More extensive, unbiased coverage will allow for regional estimates of ecosystem processes such as bivalve grazing (with biomass info), etc.
, etc.")
33
Can you teach a long-term benthic monitoring program new tricks?

34
Thanks to the EMP people

Similar presentations


 Relationship to other SF Bay efforts.>")


>")


