Download presentation
Presentation is loading. Please wait.

1
KE-100.3410 Polymer Properties
Steve Spoljaric, PhD

2
Polymer Properties (5 credits)
Learning outcomes: After completing the course, the student understands: 1) The basics of polymer physics and structure hierarchy of polymers 2) The basics of the most important methods of polymer analysis 3) Theories of polymer rheology 4) Stability and degradation of polymers 5) The ability to calculate the above mentioned phenomena
 The basics of polymer physics and structure hierarchy of polymers. 2) The basics of the most important methods of polymer analysis. 3) Theories of polymer rheology. 4) Stability and degradation of polymers. 5) The ability to calculate the above mentioned phenomena.")
3
Polymer Properties Content: Structure hierarchy in polymers
Theoretical aspects: Polymer analysis Physics Rheology Stability and degradation of polymers Calculation of polymer properties

4
Lectures and corresponding book chapters (Fried)
Lecture I (Structure and Molecular Weight) – Chapters 1 and 3.3 Lecture II (Crystallinity) – Chapter 4 Lecture III (Spectroscopic analysis techniques) – Chapters 2.6 and 4 Lecture IV (Rheology) – Chapters 5 and 11 Lecture V (Solution fractionation and permeation) – Chapters 3.2 and 12.1 Lecture VI (Stability, degradation and microscopy) – Chapter 6
 – Chapters 1 and 3.3. Lecture II (Crystallinity) – Chapter 4. Lecture III (Spectroscopic analysis techniques) – Chapters 2.6 and 4. Lecture IV (Rheology) – Chapters 5 and 11. Lecture V (Solution fractionation and permeation) – Chapters 3.2 and Lecture VI (Stability, degradation and microscopy) – Chapter 6.")
5
Schedule for the course
6 Lectures on Mondays from Lecture notes available on MyCourses 5 Problem solving exercises on Thursdays from Chemistry building, Luentosali 4, Room C301 Textbook for the course: Polymer Science and Technology, Fried JR. Exam: at Luentosali1, Luentosali2 (Chemical Technology, Kemistintie 1)
")
6
Other recommended references
Spectroscopy of Polymers, Jack L. Koenig Good for further information about spectrsocopy and charactersiaton (Lecture III) Polymer Physics, Ulf Gedde A good all-round textbook, includes some information about microscopy (Lecture VI)
 Polymer Physics, Ulf Gedde. A good all-round textbook, includes some information about microscopy (Lecture VI)")
7
Classification of polymers
Monomer and thus polymer Oil (or coal, gas) based Bio-based Polymers Synthetic Natural Polymerization mechanism Step polymerization Chain polymerization Structure Thermoplastic Thermoset Product Biodegradable or stable
 based. Bio-based. Polymers. Synthetic. Natural. Polymerization mechanism. Step polymerization. Chain polymerization. Structure. Thermoplastic. Thermoset. Product. Biodegradable or stable.")
8
Structure-property correlations
Structure considerations: Linear / branched / cross-linked Thermoplastic / thermoset Molecular weight / molecular weight distribution Homopolymer – copolymer Block, alternating, random, graft Copolymer / blend Properties: Thermal properties Glass transition temperature, melting temperature Amorphous or partly crystalline polymer Operating temperature range for continuous use Mechanical properties Tensile stress and strain, modulus, hardness, impact strength

10
Questions? How much new material was in the first few slides? Was it mostly reviewing what you have learned before? Have you completed the course ‘Polymeerien valmistus’ (Polymer synthesis)? What would you like to know more about regarding polymers? What do you think will be the topics in this course? Any comments or wishes at this moment?
 What would you like to know more about regarding polymers What do you think will be the topics in this course Any comments or wishes at this moment")
11
Polymerisation overview
Step polymerisation Chain polymerisation Radical polymerisation Emulsion polymerisation Ionic polymerisation (anionic and cationic) Co-ordination polymerisation Living radical polymerisation Atom Transfer Radical Polymerization (ATRP) Stable Free Radical Polymerization (SFRP) Reversible Addition-Fragmentation chain Transfer (RAFT) Ring-opening polymerisation Co-polymerisation
 Co-ordination polymerisation. Living radical polymerisation. Atom Transfer Radical Polymerization (ATRP) Stable Free Radical Polymerization (SFRP) Reversible Addition-Fragmentation chain Transfer (RAFT) Ring-opening polymerisation. Co-polymerisation.")
12
To begin with: What affects the molecular weight in different polymerization mechanisms? Step polymerization (stoichiometric equivalence of functional groups) Radical polymerization (initiator concentration, chain transfer) Living polymerization (monomer and initiator concentration) How is crosslinking achieved in thermoset materials? What are the crosslinks?
 Radical polymerization. (initiator concentration, chain transfer) Living polymerization. (monomer and initiator concentration) How is crosslinking achieved in thermoset materials What are the crosslinks")
13
Course content / overview
Structure and average molecular weights Solid-state properties: Crystallinity Thermal transitions Characterization methods: Thermoanalytical methods (DSC, DMTA) Structure analysis (FTIR and Raman, solution and solid NMR, fractionation SEC) Rheological properties and their measurement Solubility and gas permeability Microscopy methods, X-ray analysis Stability and degradation
 Structure analysis (FTIR and Raman, solution and solid NMR, fractionation SEC) Rheological properties and their measurement. Solubility and gas permeability. Microscopy methods, X-ray analysis. Stability and degradation.")
14
Polymer Structure

15
Stereochemistry of polymerization
Conformation: Different orientations of atoms and substituents in a molecule Result from rotations around single bonds Can be changed by bond rotations Extended chain / Helix Configuration: Isomers differ in the spatial arrangement of their atoms and substituents; that can only be changed by breaking and reforming primary chemical bonds

16
Tacticity Regularity in the configurations of successive stereocenters determines the overall order of the polymer chain: If the R groups are randomly distributed on the two sides of the planar zigzag polymer, the polymer does not have order and is atactic Ordered structures are isotactic and syndiotactic When the sterocenter of each repeating unit has the same configuration the structure is termed isotactic When the stereocenter alternate from one repeating unit to the next the structure is syndiotactic Even more complicated structures can be seen in some 1,2-disubstituted polymers

17
Tacticity: structures
Atactic Syndiotactic Isotactic

18
Tacticity: influences
In general, isotactic and syndiotactic polymers are partly crystalline and atactic are amorphous In addition to crystallinity, tacticity affects also other properties such as thermal and mechanical properties The tacticity of a polymer is determined by several factors: Polymerization temperature Pressure Catalyst Solvent

19
Tacticity in commercial polymers
Isotactic Atactic Syndiotactic Polypropylene (PP) used and sold is mostly isotactic but it is also possible to produce syndiotactic or atactic polymer Polyvinylchloride (PVC) is usually atactic but contains some syndiotactic structures which results in some crystallinity in the material. It is also possible to produce highly syndiotactic and isotactic PVC
 used and sold is mostly isotactic but it is also possible to produce syndiotactic or atactic polymer. Polyvinylchloride (PVC) is usually atactic but contains some syndiotactic structures which results in some crystallinity in the material. It is also possible to produce highly syndiotactic and isotactic PVC.")
20
Isomerism In chemistry, isomers are molecules with the same molecular formula but different chemical structures. In other words, isomers contain the same number of atoms of each element, but have different arrangements of their atoms in space Unsaturated carbons (double or triple bonds) result in different isomers: 1,3-butadiene (dienes in general) Cis and trans isomers possible Results in geometric isomerism (isotactic, syndiotactic or atactic)
 result in different isomers: 1,3-butadiene (dienes in general) Cis and trans isomers possible. Results in geometric isomerism (isotactic, syndiotactic or atactic)")
21
Geometric isomerism Geometric isomers have the same structural formulas but differ in the arrangement of groups at a single atom, at double bonds, or in rings Polybutadiene isomers: Isotactic Isotactic Syndiotactic

22
Optical isomerism (enantiomerism)
Optical isomers (also called enantiomers) are mirror images that are not superimposable (that is, they can’t be put on top of one another) They differ in only one characteristic; their interaction with plane polarized light More general in bio-based polymers An example is synthetic polymer is poly(propylene oxide)
 are mirror images that are not superimposable (that is, they can’t be put on top of one another) They differ in only one characteristic; their interaction with plane polarized light. More general in bio-based polymers. An example is synthetic polymer is poly(propylene oxide)")
23
Lactic acid-based materials
Commercial optically-active polymers are lactic acid based Lactic acid is available both in optically-active enantiomers as well as an optically-inactive racemic mixture Synthetic lactic acid is always a mixture of the two isomers, whereas in bio-technically produced lactic acid the L/D ratio can be tailored with the fermentation process Lactic acid based polymers are either optically-active or not depending on the monomer used

24
Lactic acid monomers D,L-lactic acid is a mixture of the two
D-lactic acid

25
Lactide monomers Polylactide is polymerized with Ring Opening Polymerization (ROP)
")
26
Polylactides Partly crystalline PLA Amorphous PLA

27
Average molecular weights

28
Average molecular weights
29
Average molecular weights
30
Average molecular weights
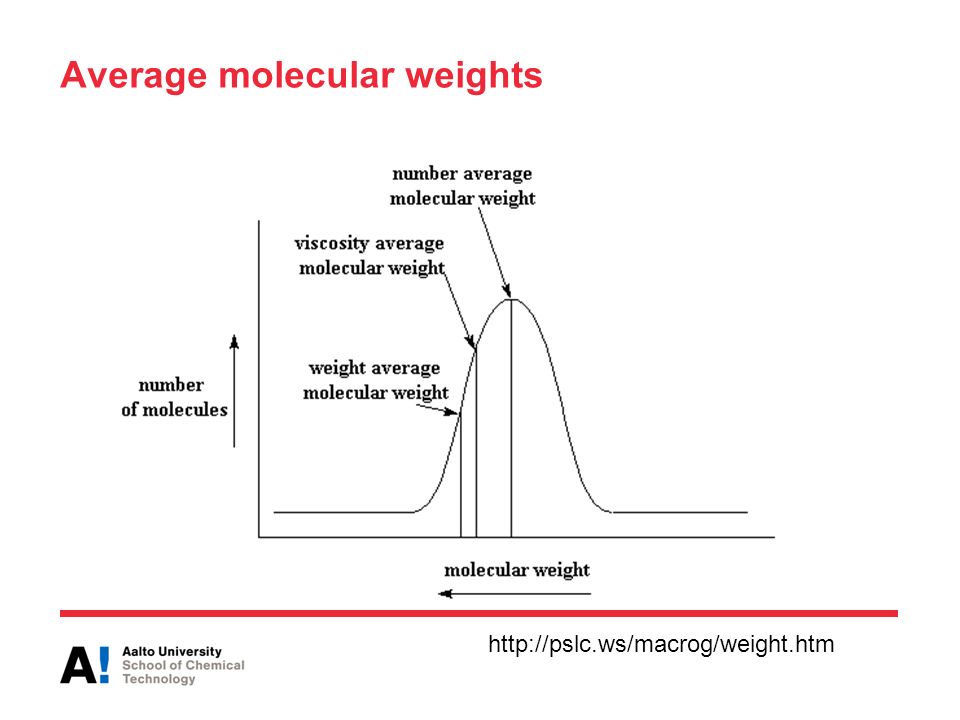
Number average molecular weight: Weight average molecular weight Viscocity average molecular weight

31
Average molecular weights
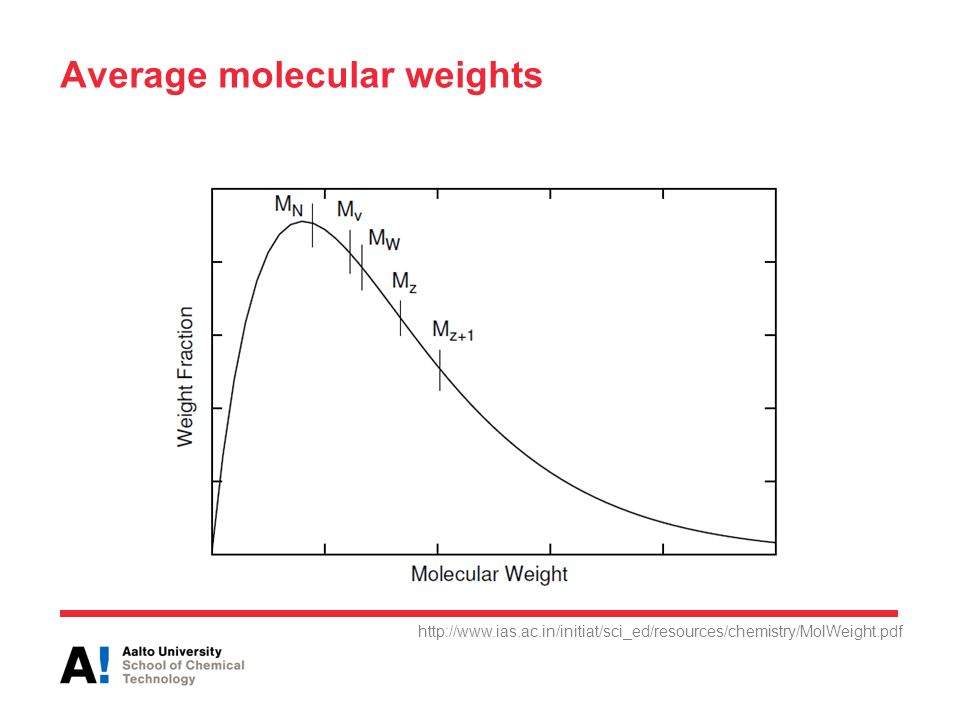
Z-average molecular weight Polydispersity ni = Number of molecules with molecular weight Mi wi = weight fraction with molecular weight Mi a = constant, depends on polymer/solvent combination

32
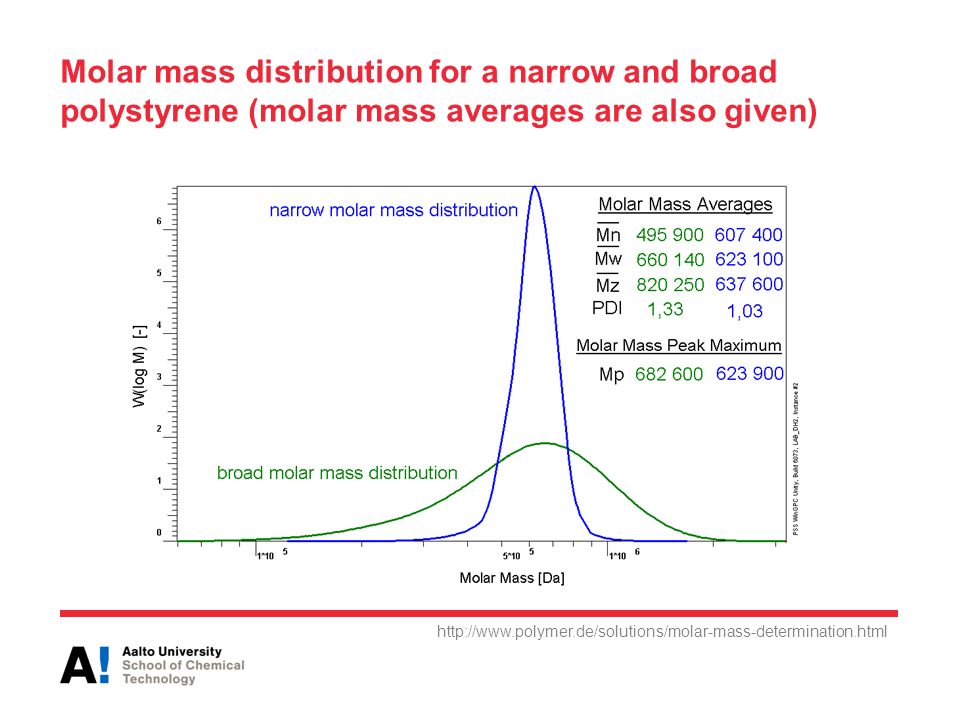
Molar mass distribution for a narrow and broad polystyrene (molar mass averages are also given)
33
Molar mass vs. molecular weight
Molar mass is the mass of one mole of a substance Molecular weight is the mass of one molecule of a substance

34
Determination of average molecular weights
Primary (absolute values) methods: Osmometry (Mn) Scattering (Mw) Sedimentation (Mz) Z-average molecular weight is obtained from centrifugation data Secondary (relevant to reference or calibration) methods: Gel permeation chromatography (GPC), also called size exclusion chromatography (SEC) to obtain molecular weight distribution Intrinsic viscosity for determining viscosity average molecular weight
 methods: Osmometry (Mn) Scattering (Mw) Sedimentation (Mz) Z-average molecular weight is obtained from centrifugation data. Secondary (relevant to reference or calibration) methods: Gel permeation chromatography (GPC), also called size exclusion chromatography (SEC) to obtain molecular weight distribution. Intrinsic viscosity for determining viscosity average molecular weight.")
35
Average molecular weight Range of molecular weight
Determination of average molecular weights Method Relative/ absolute Average molecular weight Range of molecular weight Comments Ebulliometry A < 104 Insensitive Cryoscopy Small sample size Membrane osmometry 5x Difficulties with the membrane, slow measurement Vapor pressure osmometry < 3x10⁴ Only few suitable solvents End-group analysis x104 Restricted to low molecular weights, assumption of 2 end-group/molecule Light scattering Insensitive for small molecules, slow measurement MALLS, LALLS Ultracentrifugation 2x Slow measurement, expensive instrument Viscometry S% Simple measurement, inexpensive instrument SEC (GPC) all Gives molecular weight distribution. Requires calibration.
 all. Gives molecular weight distribution. Requires calibration.")
36
Number average molecular weight

37
Number average molecular weight
Determination methods based on various phenomena or factors: End groups Property changes Osmotic pressure Increase in boiling point Decrease in freezing point or vapour pressure

38
Osmometric measurement
Pure solvent and a dilute solution of polymer in the same solvent are placed on opposite sides of a semi-permeable membrane Membrane will allow the solvent to pass through but will retain the polymer molecules in solution In equilibrium the difference in the heights of the solvent and solution in capillaries can be used to calculate the osmotic pressure

39
Osmometric measurement
Van’t Hoff equation for the osmotic pressure of an ideal, dilute solution: p = osmotic pressure c = concentration R = gas constant T = temperature (K) = number average molecular weight (g/mol) g = gravitational constant m/s2 ρ = solvent density
 = number average molecular weight (g/mol) g = gravitational constant m/s2. ρ = solvent density.")
40
Osmometric measurement
Van’t Hoff equation is for ideal, dilute solutions. In real solutions the equation will be following: For the determination of molecular weight, 4-6 pressure measurements with different concentrations are required. When solutions are dilute enough, p/c can be obtained by extrapolation of c to 0. Average molecular weight can be calculated from: Polymer concentration is g/dm3 and p/c in J/kg B, C are virial coefficients

41
Osmometric measurement: determining π/c
PS in toluene PS in acetone c (g/dm3)
")
42
Osmometric measurement: challenges
Simple experimental procedure, but can be very time consuming Performance of the membrane can be a problem Membrane can let some smaller polymer molecules through and this will result in an artificially-higher Mn value Thus, the method is considered accurate for molecular weights above 20,000 g/mol The upper limit for molecular weight is 500,000 g/mol due to inaccuracy in measuring small osmotic pressures

43
Vapor-pressure osmometry
When a polymer is added to a solvent, the vapor pressure of the solvent is lowered due to the decrease in solvent activity Osmometry uses two matched thermistors that are in a closed chamber containing saturated solvent vapor A drop of solvent and a drop of dilute polymer solution is placed on thermistors Condensation of solvent vapor onto the solution causes the temperature of the solution thermistor increase until vapor pressure of solution equals to that of a solvent

44
Vapor-pressure osmometry cont.
The difference in temperatures is recorded in terms of difference in resistance DR, which is calibrated by use of a standard low molecular weight sample Several polymer concentrations are measured and extrapolation of DR/c to zero concentration yield Mn (requires calibration constant obtained with the standard sample hence VPO is secondary method)
")
45
Vapor-pressure osmometry: measurement principles
Closed chamber Pure solvent For the characterization of low molecular weight oligomers and polymers, vapor-pressure osmometry is recommended

46
Ebullioscopic method Tb = increase in Tb Kb = ebullioscopy constant
The determination of molecular weight, in which the differential thermometer is used to measure the rise in boiling point Boiling point of the polymer solution is compared to the boiling point of the solvent. An increase in boiling point is comparable to polymer properties: Top limit of the measurement is g/mol Tb = increase in Tb Kb = ebullioscopy constant WA = mass of the polymer WS = mass of the solvent

47
Cryoscopic method Kf = cryoscopic constant
Resembles ebullioscopy method Compares the freezing point of a polymer solution and pure solvent For dilute solutions: Top limit of the measurement is g/mol Kf = cryoscopic constant

48
End group method The structure of the polymer chain must be known!!!
End groups to be either quantitatively determined with appropriate reagents (titration) or determined by IR or NMR IR: Number average molecular weight can be calculated assuming the chain is linear with no branch points Number of end groups of the polymer is thus one or two per molecule End groups are not spectroscopically coupled to the remainder of the chain, low molecular weight analogs can be used for calibration Particularly useful for insoluble systems (eg. fluorocarbons)
 or determined by IR or NMR. IR: Number average molecular weight can be calculated assuming the chain is linear with no branch points. Number of end groups of the polymer is thus one or two per molecule. End groups are not spectroscopically coupled to the remainder of the chain, low molecular weight analogs can be used for calibration. Particularly useful for insoluble systems (eg. fluorocarbons)")
49
Viscosity average molecular weight

50
Viscosity average molecular weight
Based on the determination of intrinsic viscosity of a polymer solution through measurements of solution viscosity Widely used for routine molecular weight determination Cheap equipment and simple measurement procedure In this method, the viscosities of pure solvent and dilute polymer solutions are compared To determine the molecular weight, the empirical constants K and a, that are specific for a given polymer, solvent and temperature, need to be known. Extensive libraries of the values for constants exist for different polymer solvent combinations

51
Staudinger equation hsp = specific viscosity
Staudinger equation is valid only for a relatively narrow molecular weight distribution hsp = specific viscosity c = solution concentration Km = constant for specific polymer-solvent combination

52
Mark-Houwink equation
Mark-Houwink equation is valid for broad molecular weight distribution: [h] = intrinsic viscosity = viscosity average molecular weight K and a = constants for particular polymer-solvent combination For flexible polymer chains a is , for stiff and rod like chains a is 2.0.

53
Mark-Houwink equation: K and a constants
Values for the constants can be found in: ‘Polymer Handbook’, Bandrup, J., Immergut, EH. (ed.) Some examples of polymer/solvent combinations
 Some examples of polymer/solvent combinations.")
54
Viscosity parameters Capillary viscometers are used to carry out the measurement: Ostwald-Fenske or Ubbelodde type capillary Constant temperature, typically 25 or 30°C The time required for a dilute solution and pure solvent to pass through the capillary is measured 4-6 polymer solutions are measured Efflux times need to be more than 100 s, which can then be used to calculate the relative viscosity: t = efflux time for dilute polymer solution T0 = efflux time for pure solvent h = dynamic viscosity of the solution h0 = dynamic viscosity of the solvent

55
Capillary viscometers (‘U’ tubes)
Ostwald Uppelohde Reverse flow The time for the fluid to fall or rise between marks A and B determines the flow rate (Q) The pressure drop (DP) is calculated from the head of fluid The viscosity can be determined from these values and the geometry of the viscometer
 The pressure drop (DP) is calculated from the head of fluid. The viscosity can be determined from these values and the geometry of the viscometer.")
56
Viscosity parameters Specific viscosity can be calculated from viscosities or the efflux times: The viscosity number or reduced viscosity is obtained by dividing specific viscosity by the solution concentration: Molecular weight determination, Rheological measurements in Polymers: Polymer Characterization and Analysis, Ed. J.I. Krowchwitz, John Wiley & Sons Inc, 1990

57
Viscosity parameters Logarithmic viscosity number, inherent viscosity:
Limiting viscosity number, intrinsic viscosity is obtained from the parameters of logarithmic viscosities

58
Viscosity measurement
Unit used in concentration is g/cm3

59
Viscosity measurement
Measuring viscosity for several polymer solutions with different concentrations, the intrinsic viscosity can be determined graphically: sp /C inh red C Huggins/Kraemer Plot

60
Weight average molecular weight

61
Light scattering in nature
Why is the sky blue? How can we see clouds? Lord Rayleigh 1871 When light passes through matter, most of the light continues in its original direction but a small fraction is scattered in other directions incident beam scattered light Notes: Simple questions about our everyday world, such as “Why is the sky blue?”, “How can we see clouds?”, or “Why are sunsets red?” have interesting answers that depend upon light scattering. In fact, it was the question of the blue sky and the polarization of skylight that lead Lord Rayleigh to develop a theoretical description of light scattering in 1871. When light passes through matter, most of the light continues in its original direction. However, some of the light is scattered into new directions. A careful analysis of the scattered light can yield detailed information about the scattering system.

62
Light scattering in the lab
In the lab we can control polarization, wavelength (l) and intensity (Ii) of the coming light We can detect the scattered light (Is) as a function of angle (q) Scattered light is proportional to the concentration and molecular weight of the polymer Notes: In the laboratory we can control the conditions to retrieve detailed information about the light scattering. We can choose the wavelength (l), polarization, and intensity (Ii) of the incident light. The size of the laser beam and the field of view of the detector define a scattering volume. We can detect the scattered light (Is) from this volume as a function of angle (q) and polarization. With such exquisite control of the experimental parameters, we can use light scattering to retrieve fundamental physical properties of the scattering medium.
 and intensity (Ii) of the coming light. We can detect the scattered light (Is) as a function of angle (q) Scattered light is proportional to the concentration and molecular weight of the polymer. Notes: In the laboratory we can control the conditions to retrieve detailed information about the light scattering. We can choose the wavelength (l), polarization, and intensity (Ii) of the incident light. The size of the laser beam and the field of view of the detector define a scattering volume. We can detect the scattered light (Is) from this volume as a function of angle (q) and polarization. With such exquisite control of the experimental parameters, we can use light scattering to retrieve fundamental physical properties of the scattering medium.")
63
Light scattering The weight average molecular weight can be obtained directly only by scattering experiments Most commonly used is light scattering from dilute polymer solution Polymer molecules in solution cause stronger scattering than solvent molecules The intensity of the light is proportionate to the absolute molecular weight of the particle causing the scattering

64
Light scattering procedure
Polymer is dissolved in appropriate solvent The particles have interactions in solution and self organize Local changes in concentration and density in solution Light scattering is observed in different angles Measurements with several concentrations and angles

65
Light scattering Intensity distribution of LS at various angles for a small particle (dashed line) and a large polymer molecule (solid line)
 and a large polymer molecule (solid line)")
66
Light scattering instrumentation
Conventional LS instrumentation showing incident and scattered light, sample cell, and photomul’plier (Fried et al.)
")
67
Light scattering In order to determine molecular weight, the following information must be known/determined: Refractive index for the solvent Difference between refractive indices for the solution and solvent Polymer concentration Absolute light intensity for certain scattering angles

68
Light scattering Rayleigh formula:
Problem is determining R(q) value, which should be known for all values n0 = refractive index for solvent l = wavelength of the light N0= Avogadro number Rb= Rayleigh constant I0= light intensity at 90o angle that scattered from solvent c = polymer concentration in solution = measuring angle R = measured intensity, contains the angle and correction for concentration
 value, which should be known for all values. n0 = refractive index for solvent. l = wavelength of the light. N0= Avogadro number. Rb= Rayleigh constant. I0= light intensity at 90o angle that scattered from solvent. c = polymer concentration in solution. = measuring angle. R = measured intensity, contains the angle and correction for concentration.")
69
Low-Angle Laser Light scattering (LALLS)
Helium-Neon lasers have replaced conventional light sources in scattering instruments The high intensity of the light sources permits measurements at much smaller angles (2–10 o). Then, the scattering by small spherical particles can be expressed: Only at one single angle chain dimensions cannot be obtained
. Then, the scattering by small spherical particles can be expressed: Only at one single angle chain dimensions cannot be obtained.")
70
Multi-Angle Laser Light-Scattering (MALLS)
Several detectors (18 angles, 20–150 o ) Absolute molar mass (Mn, Mw, - Mz) and size (Rz , rh) No standard references, more reliable than calibration techniques Information about molecules and particles (conformation, branching, partly cross-linked fractions) Co-polymer, protein, aggregate detection Easy and fast to use
 Absolute molar mass (Mn, Mw, - Mz) and size (Rz , rh) No standard references, more reliable than calibration techniques. Information about molecules and particles (conformation, branching, partly cross-linked fractions) Co-polymer, protein, aggregate detection. Easy and fast to use.")
71
DAWN 8+ 8 angles (23-155 °) Molar mass range <10³-107 g/mol
Molecular size range nm Laser wavelength 658 nm (50mW GaAs linear polarized laser) All solvents compatible (aqueous and organic) photodiode detectors incident beam
 All solvents compatible (aqueous and organic) photodiode detectors. incident beam.")
72
Gel permeation chromatography (GPC )
aka: Size-exclusion chromatography (SEC)
")
73
Gel permeation chromatography (GPC)
Most widely used method for routine determination of molecular weight and molecular weight distribution is GPC Separates samples of polydisperse polymers into fractions of narrower molecular weight distributions

74
Principle of GPC: Polystyrene gel Polymer molecules

75
GPC measurement Columns are packed with small, highly porous beads or gel Pore diameters of the beads range from 10 to 107 Å Approximately the dimensions of polymer molecules in solution During GPC operation, pure pre-filtered solvent is continuously pumped through the columns at a constant flow rate. Then a small amount of dilute polymer solution is injected into the solvent stream and carried to through the columns Polymer molecules diffuse from this mobile phase into the stationary phase in the pores. The smallest polymer molecules penetrate deeply into the pores whereas the largest molecules pass through the columns first

76
GPC measurement Comprehensive Analytical Chemistry vol 53: Molecular Characterization and Analysis of Polymers, editors John M.Chalmers, Robert J. Meier, 2008

77
GPC measurement The concentration of polymer molecules in each eluting fraction is monitored by a detector, such as IR The elution volumes are calibrated with know Mn standards (PS and PMMA standards are most common) Only apparent molecular weights are determined unless: Molecular weight standards exist of the same composition and topology as the samples LALLS or viscometry is used Mark–Houwink parameters of the standards and sample are known
 Only apparent molecular weights are determined unless: Molecular weight standards exist of the same composition and topology as the samples. LALLS or viscometry is used. Mark–Houwink parameters of the standards and sample are known.")
78
Solvent peak CHCl3 Typical GPC 3 sample curves overlaid

79
GPC distribution plot (data on following slide)
")
80
GPC results example, cont.
Room temperature, chloroform eluent, PS standards Sample 1: Weight average molecular weight 6040 g/mol Number average molecular weight 2980 g/mol Polydispersity (Mw/Mn) 2.0 (Think about the accuracy when reporting results) Mp is the molecular weight of the standard at the peak maximum 6550 g/mol
 2.0 (Think about the accuracy when reporting results) Mp is the molecular weight of the standard at the peak maximum 6550 g/mol.")
81
GPC GPC is the most widely used technique for the analysis of polymers
Can be used for samples soluble in organic and aqueous eluents and molecular weights from approximately 100 to several million Yields all molecular weight averages and the molecular weight distribution The analysis of the molar mass distribution of polyethylene and polypropylene samples by GPC requires elevated temperature operation for dissolution Room temperature GPC and GPC operating at higher temperature (for polyolefins 120ᵒC)
")
82
Effect of molecular weight on polymer properties

83
Properties dependent on Molecular Weights and Molecular Weight Distributions (MWD)
Polymer Monodisperse (uniform) Proteins, nucleic acids Polydisperse (non-uniform) All synthetic polymers Melt Viscosity Tensile Strength Toughness or Impact Strength Resistance to heat Corrosive properties
 Proteins, nucleic acids. Polydisperse (non-uniform) All synthetic polymers. Melt Viscosity. Tensile Strength. Toughness or Impact Strength. Resistance to heat. Corrosive properties.")
84
Effect of the molecular weight on polymer properties
Great effect on properties Some properties have a limit, like Tg and strength at break, whereas some can change without any limit as the molecular weight increases. Dependence of Tg on average molecular weight: A and B are experimental constants Tg, is glass transition temperature of a extremely high molecular weight polymer

85
Effect of the molecular weight on polymer properties
Many mechanical properties exhibit similar dependence on molecular weight: P = property value K’ = constant

86
Effect of the molecular weight on polymer properties
Tensile strength (Mpa) Inverse of molecular weight (106/M) Tensile strength of PS in proportion to molecular weight Tensile strength (Mpa)
 Inverse of molecular weight (106/M) Tensile strength of PS in proportion to molecular weight. Tensile strength (Mpa)")
87
Effect of molecular weight and PDI on properties
Examples of how average molecular weight and molecular weight distribution affect different properties: Property Molecular weight increases Molecular weight distribution narrows Tensile strength + Tensile strain - Strength at yield Ductility Brittleness Hardness Softening point Melt viscosity Adhesion Chemical endurance Solubility o Property: + = improves - = worse o = little effect

88
Crystallinity Thermal transitions
Next week: Crystallinity Thermal transitions

Similar presentations


 – What color? Does it fluoresce.>")


