Download presentation
Presentation is loading. Please wait.

1
Nebraska Energy Burden Study 2015 Update Public Service Commission October 27, 2015 Jerry Deichert Center for Public Affairs Research University of Nebraska at Omaha jdeicher@unomaha.edu jdeicher@unomaha.edu 402-554-2134 www.unomaha.edu/cparwww.unomaha.edu/cpar www.facebook.com/unocparwww.facebook.com/unocpar

2
Nebraska Energy Burden Study: 2015 Update The purpose of this study is to update the estimates of the energy burden of households in Nebraska that were developed in 2009. This study reviews information for the 2011- 2013 period. Previous studies analyzed information for the 2010-2012, 2009-2011, 2008-2010, 2007- 2009, 2006-2008, and 2005-2007 periods.

3
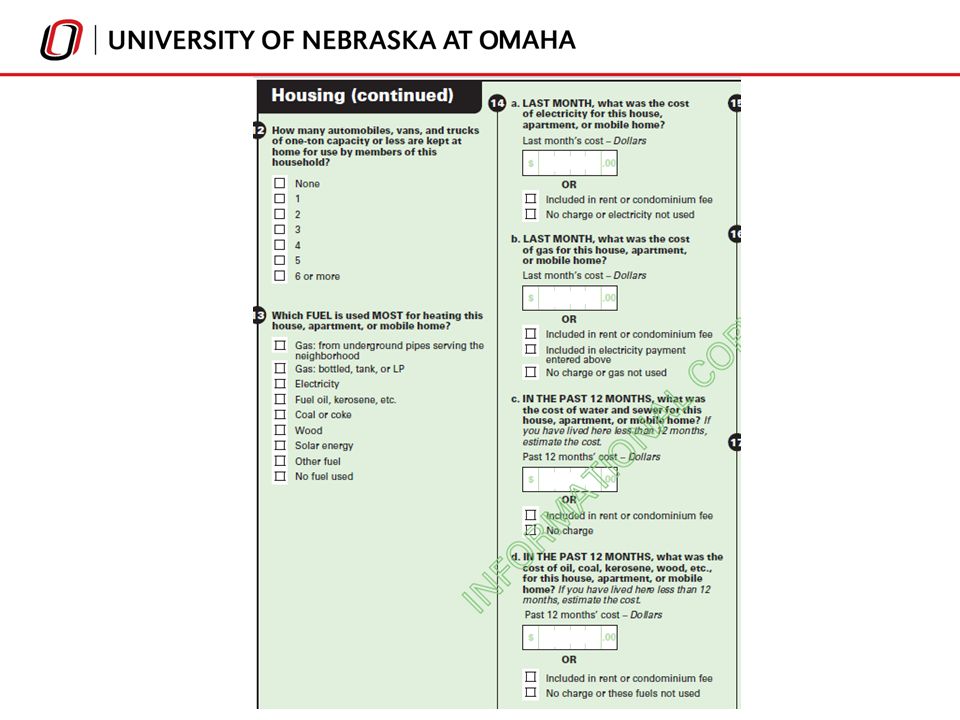
Data Source Main Data Source: U.S. Census Bureau, American Community Survey, Three-Year Public Use Microdata Sample: 2005-2007 through 2011-2013 Data elements Household income Cost of electricity Cost of gas Cost of oil, kerosene or wood

4
Definition of Energy Burden Energy burden may be defined as the percentage of annual household income that is used to pay annual energy bills Energy burden = (Annual Energy Bill) / (Annual Income) * 100 percent
 / (Annual Income) * 100 percent")
5
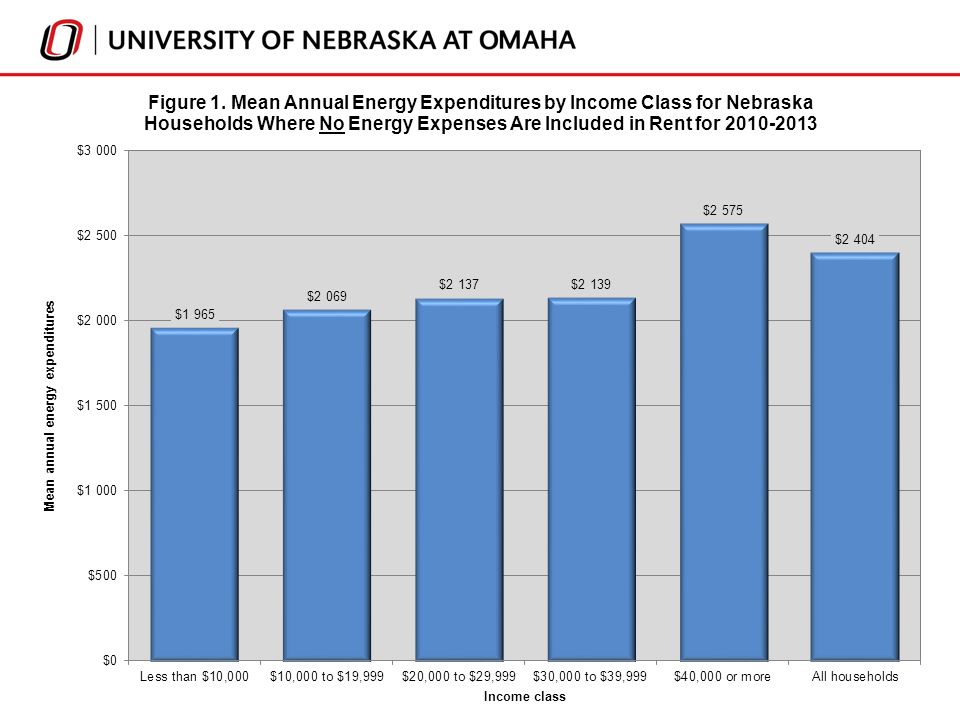
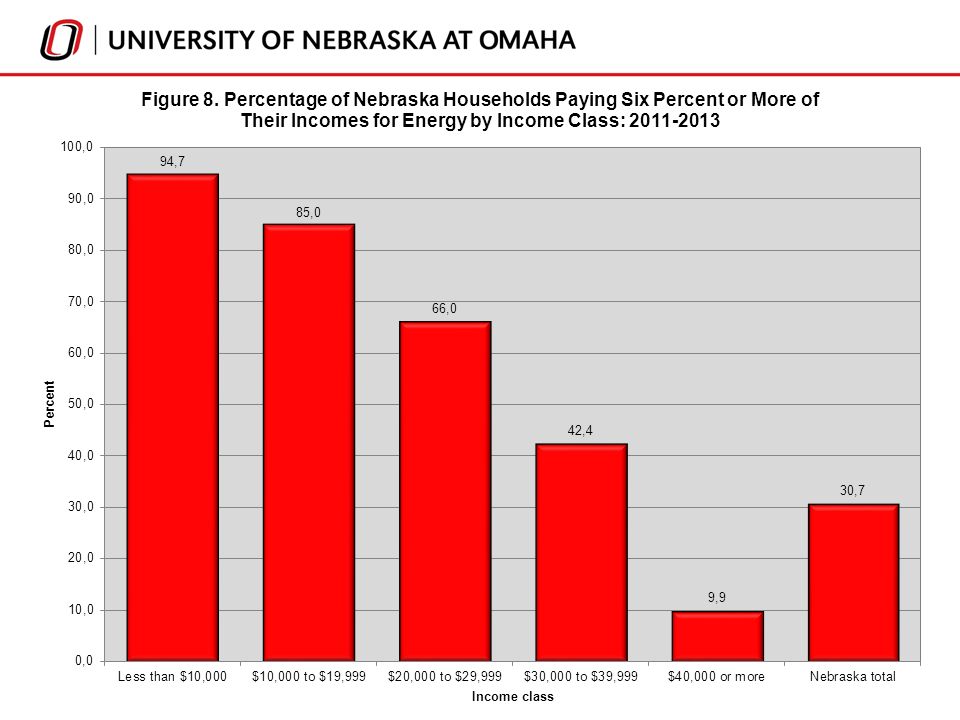
Energy Expenditures By Income In general, annual energy expenditures are slightly lower for households with lower incomes, but the energy burden is substantially higher. For Nebraska households with incomes less than $10,000 in 2011-2013 Average annual energy expenditures were $1,945 Average energy burdens were 46.4%

6
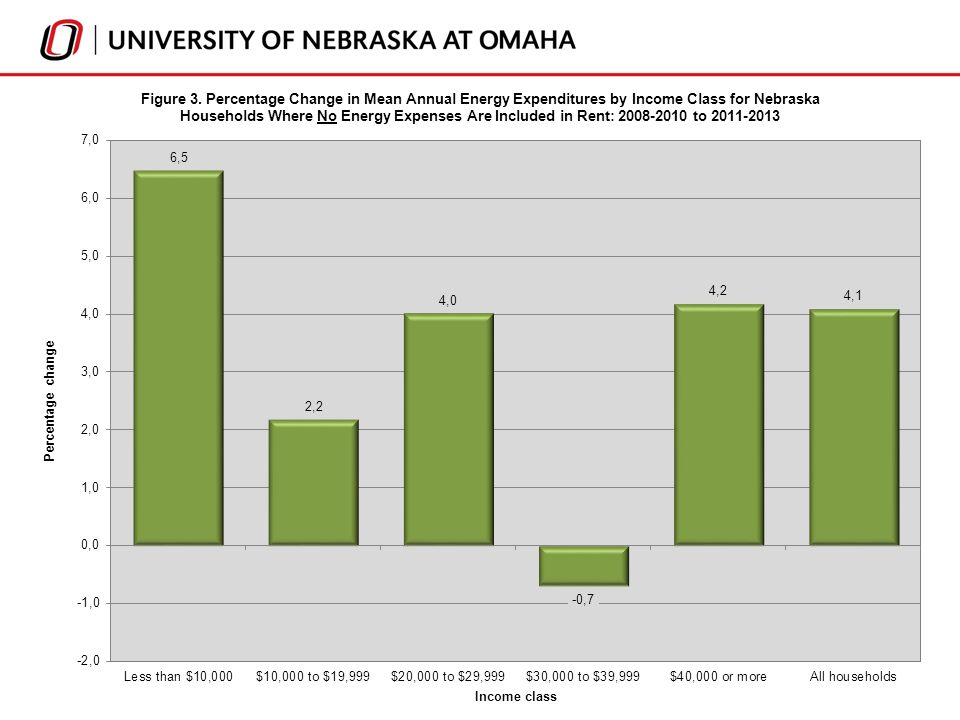
Table 1. Energy Burden by Income Class for Households Where No Energy Expenses Are Included in Rent for Nebraska: 2005-2007 to 2011-2013 Income Class Time period Less than $10,000 $10,000 to $19,999 $20,000 to $29,999 $30,000 to $39,999$40,000 or moreAll households Mean annual energy expenditures 2005-2007$1,944$1,918$1,954$2,041$2,350$2,197 2006-2008$1,988$2,014$2,053$2,139$2,473$2,317 2007-2009$1,875$1,984$2,000$2,126$2,439$2,273 2008-2010$1,845$2,024$2,055$2,153$2,472$2,310 2009-2011$1,923$2,086$2,096$2,162$2,522$2,358 2010-2012$1,945$2,078$2,105$2,142$2,548$2,379 2011-2013$1,965$2,069$2,137$2,139$2,575$2,404 Mean annual household income 2005-2007$5,629$15,125$24,915$34,658$86,646$60,914 2006-2008$5,445$15,008$24,945$34,833$89,175$64,036 2007-2009$5,510$15,197$25,096$34,855$88,882$62,927 2008-2010$5,237$14,873$24,852$34,701$89,989$64,181 2009-2011$5,115$15,026$24,904$34,713$93,224$66,532 2010-2012$5,087$14,956$24,890$34,732$93,956$67,826 2011-2013$5,127$15,102$24,888$34,629$96,441$70,069 Mean energy expenditures as a percent of household income 2005-200742.513.28.05.93.27.4 2006-200844.514.08.36.23.37.4 2007-200943.413.68.16.13.37.5 2008-201045.114.18.46.23.47.5 2009-201145.914.38.56.33.37.5 2010-201246.414.38.66.23.37.5 2011-201346.714.18.76.23.37.5

10
Table 2. Energy Expenditures and Burdens by Relation of Income to Poverty for Nebraska Households Where No Energy Expenses Are Included in Rent: 2011-2013 Ratio of income to poverty Annual energy expenditures (mean) Energy expenditures as a percent of household income (mean) Number of households Under 100%$2,18330.174,532 Under 125%$2,18024.3107,560 Under 150%$2,19321.0139,041 Under 200%$2,23317.1198,810
 Energy expenditures as a percent of household income (mean) Number of households Under 100%$2, ,532 Under 125%$2, ,560 Under 150%$2, ,041 Under 200%$2, ,810.")
11
Map 1. Nebraska Regions

16
For 2011-2013, some of the highest mean annual energy burdens are for households that: Have incomes below $30,000 or below 200 percent of poverty Are linguistically isolated Live in a rental housing unit Live in a housing unit that is owned free and clear Consist of families with householders with no spouse present, especially female householders Consist of persons living alone, especially single women Have no children under 18 years living in the household Have exactly one person 60 years or older living in the household Have exactly one person 65 years or older living in the household Live in housing units with 6 or fewer rooms Heat with a fuel other than electricity or utility gas Live in a house built prior to1980 Live in Greater Nebraska, Eastern Douglas County, or North Lancaster County

17
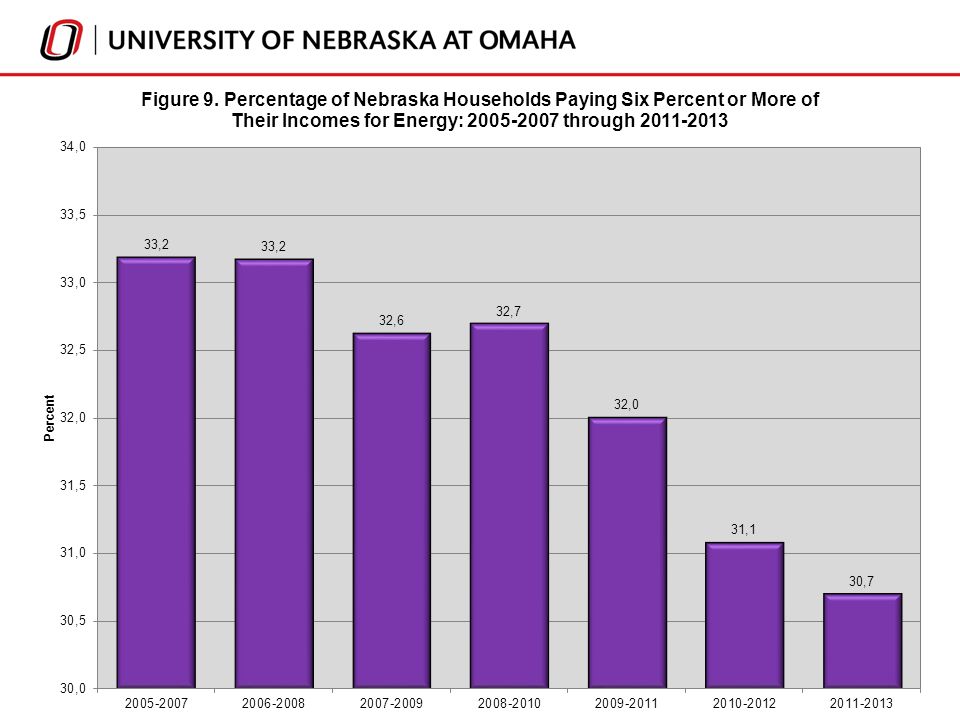
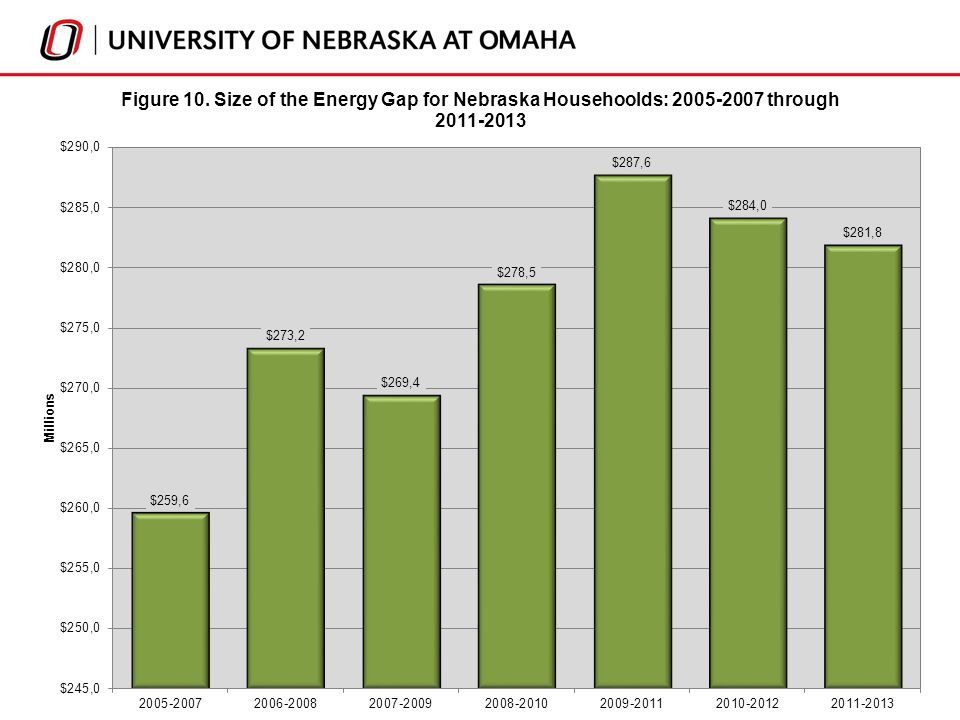
Energy Gap Roger Colton of Fisher, Sheehan, and Colton advocates that the maximum affordable level of energy expenditures for the average household should be about 6% of income Energy gap is defined as the difference between the affordable level of energy expenditures (6% of income) and actual energy expenditures
 and actual energy expenditures")
Similar presentations


 June 2009.>")


 Source: U.S. Census Bureau,>")
 Age 18-24 Age 25-64 Speak English Poorly or Not at All – Age 18 to 64 (%) High.>")
 Age 18-24 Age 25-64 Speak English Poorly or Not at All – Age 18 to 64 (%) High.>")


