Download presentation
Presentation is loading. Please wait.

1
KATEWINTEREVALUATION.com Evaluating the RAM Program An Introduction October 22, 2015; Farmingdale, NY

2
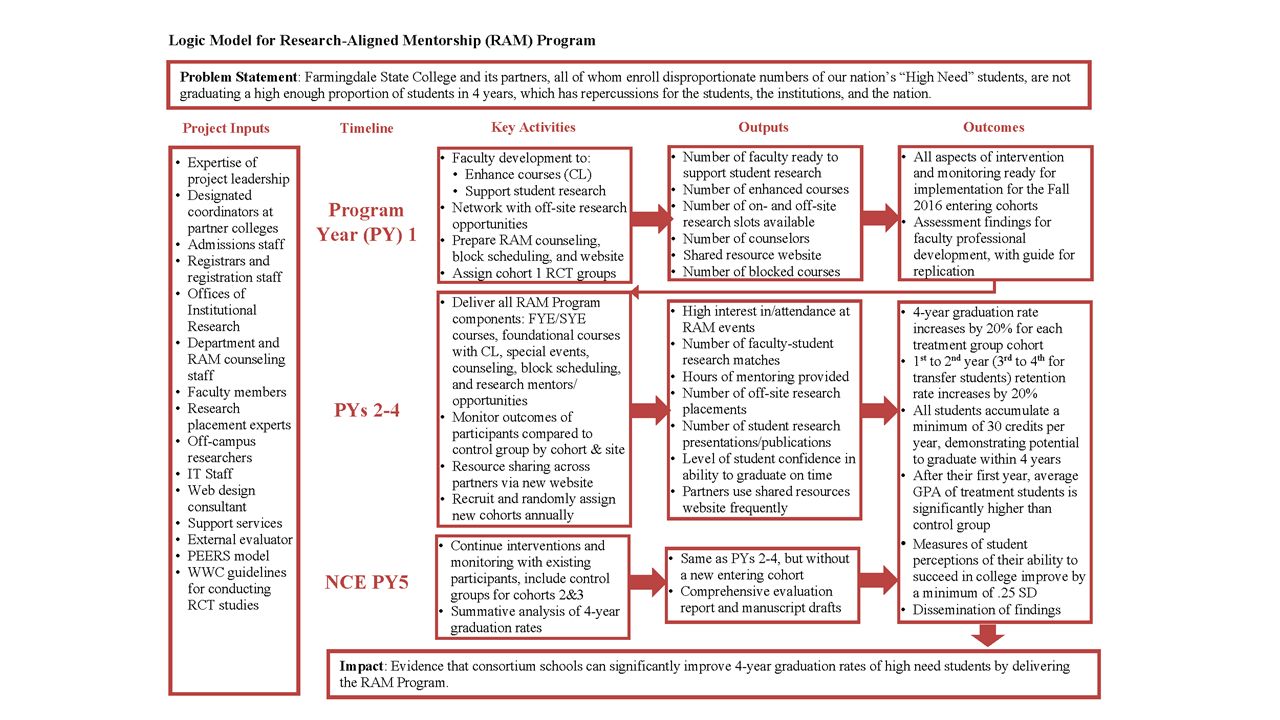
KATEWINTEREVALUATION.com Overview RAM Logic Model Research Question Summary of Intervention and Preparation Impact Evaluation Approach Selection and Assignment Headcounts Cohort Progression and Timing Attrition Impact Evaluation Plan Implementation Evaluation Plan Evaluation Timeline Q&A

4
KATEWINTEREVALUATION.com Research Question Does the Research-Aligned Mentorship (RAM) program (i.e., the intervention) result in significantly increased 4-year graduation rates of high needs students, as compared to the business-as-usual condition?
 program (i.e., the intervention) result in significantly increased 4-year graduation rates of high needs students, as compared to the business-as-usual condition")
5
KATEWINTEREVALUATION.com Summary of Intervention Objectives: Increase participating students’: Self-perception of ability to succeed in college First year GPA (third year for transfers) Rate of credit completion (min. 30 cr. per year) 1 st to 2 nd (3 rd to 4 th ) year retention (by 20%) 4-year graduation rate (by 20%) Target population: full-time first-time entering freshmen and transfer students with at least 60 credits,* meeting at least 1 of 4 aspects of “high need” but not EOP Duration: 2-years for freshmen, 1-year for transfers
 1 st to 2 nd (3 rd to 4 th ) year retention (by 20%) 4-year graduation rate (by 20%) Target population: full-time first-time entering freshmen and transfer students with at least 60 credits,* meeting at least 1 of 4 aspects of high need but not EOP Duration: 2-years for freshmen, 1-year for transfers.")
6
KATEWINTEREVALUATION.com Summary of Intervention (Cont.) Activities: First-year & sophomore-year/junior-year experience courses Special events: a welcoming reception, speakers (often distinguished researchers), and social occasions/group-building exercises Required counseling (RAM counselors: 4x within first 2 years for freshmen, 3x in junior year for transfers; Dept. counselors 1x/yr) Digital Roadmap Partial block scheduling Teaching and learning through hands-on research
 Digital Roadmap Partial block scheduling Teaching and learning through hands-on research.")
7
KATEWINTEREVALUATION.com Program Preparation (Year 1) Faculty professional development Networking with off-site research opportunities Preparation of RAM counseling, partial block scheduling, and website Finalization of evaluation design, data collection plan, and schedule Assignment of cohort 1 RCT treatment and control groups
 Faculty professional development Networking with off-site research opportunities Preparation of RAM counseling, partial block scheduling, and website Finalization of evaluation design, data collection plan, and schedule Assignment of cohort 1 RCT treatment and control groups")
8
KATEWINTEREVALUATION.com Impact Evaluation Approach Randomized Controlled Trial (RCT) Random selection and random assignment of students 2 sets (treatment and control) per institution (entering freshmen and transfers, separately) Treatment conditions get RAM program elements; control conditions get “business as usual” Analysis at school and aggregate levels, with comparisons by student demographic within-group as appropriate
 Random selection and random assignment of students 2 sets (treatment and control) per institution (entering freshmen and transfers, separately) Treatment conditions get RAM program elements; control conditions get business as usual Analysis at school and aggregate levels, with comparisons by student demographic within-group as appropriate")
9
KATEWINTEREVALUATION.com Analysis Plan Analysis will be conducted for each school, for each group within a school, for each group across schools, and for all students across all schools. “Design and Development” educational research

10
KATEWINTEREVALUATION.com Contrast Mapping ControlTreatment TransferFreshmen GPA, Gender, SES, 1 st Gen, race, adult learner Across and within all institutions: T(all) vs. C(all) T(all-lgpa) vs. C(all-lgpa) T(all-w) vs. C(all-w) T(all-m) vs. C(all-m) T(all-lses) vs. C(all-lses) T(all-urm) vs. C(all-urm) T(all-nonurm) vs. C(all-nonurm) T(all-lap) vs. C(all-lap) T(all-ef) vs. C(all-ef) T(all-tr) vs. C(all-tr) T(all-ef-w) vs. C(all-ef-w)….
 T(all-lgpa) vs. C(all-lgpa) T(all-w) vs. C(all-w) T(all-m) vs. C(all-m) T(all-lses) vs. C(all-lses) T(all-urm) vs. C(all-urm) T(all-nonurm) vs. C(all-nonurm) T(all-lap) vs. C(all-lap) T(all-ef) vs. C(all-ef) T(all-tr) vs. C(all-tr) T(all-ef-w) vs. C(all-ef-w)…..")
11
KATEWINTEREVALUATION.com Selection and Assignment of Students Determination of eligibility as entering freshmen or transfers at each partner institution Random selection of needed number of students (+) for both conditions of both sets Random assignment of both sets to either treatment or control conditions Determination of baseline equivalence for each set and of representation of population Monitoring of intervention participation by cohort for cross-overs and no-shows, during intervention and until graduation
 for both conditions of both sets Random assignment of both sets to either treatment or control conditions Determination of baseline equivalence for each set and of representation of population Monitoring of intervention participation by cohort for cross-overs and no-shows, during intervention and until graduation")
12
KATEWINTEREVALUATION.com Student Headcounts* InstitutionNeeded Annually Per Condition Treatment Total/yr 4-yr Total Headcount 4-yr Treatment Farmingdale State College (SUNY) – NY 5001252502,0001,000 Bowie State U – MD20050100800400 Central Connecticut State U – CT U 20050100800400 Kean University – NJ20050100800400 SUNY College at Old Westbury NY 20050100800400 TOTAL1,3003256505,2002,600
 – NY ,0001,000 Bowie State U – MD Central Connecticut State U – CT U Kean University – NJ SUNY College at Old Westbury NY TOTAL1, ,2002,600")
13
KATEWINTEREVALUATION.com Cohort Progression and Timing YearEntering FreshmenTransfers PY1Program Development and Preparation PY2Cohort 1 Year 1Cohort 1 Year 3 PY3C1 Y2; C2 Y1C2 Y3; Monitor C1 (Y4) PY4C2 Y2; C3 Y1; Monitor C1 (Y3)C3 Y3; Monitor C2 (Y4) NCE Y5C3 Y2; Monitor C1 (Y4) & C2 (Y3) Control Group for C3 Y2 included Monitor C3 (Y4)
 PY4C2 Y2; C3 Y1; Monitor C1 (Y3)C3 Y3; Monitor C2 (Y4) NCE Y5C3 Y2; Monitor C1 (Y4) & C2 (Y3) Control Group for C3 Y2 included Monitor C3 (Y4)")
14
KATEWINTEREVALUATION.com Key Attrition Points: This RCT design can only meet WWC standards without reservations with low or moderate attrition With moderate attrition, we must show baseline equivalence and verify random assignment

15
KATEWINTEREVALUATION.com To Meet WWC Standards without Reservations: Attrition must be as low as possible, overall, and similar for both the treatment and control groups.

16
KATEWINTEREVALUATION.com Impact Evaluation Formative and Summative Assessment

17
KATEWINTEREVALUATION.com Impact Evaluation Questions 1.Analyses of treatment students compared to control students: a.Is first year GPA higher (third year for transfers)? b.Are more credits earned each year (min. 30)? c.Is 1 st to 2 nd year retention (freshmen) and 3 rd to 4 th year retention (transfers) 20% higher? d.Is the percentage of students graduating within 4 years 20% higher? 2.Within treatment group analyses: a.To what extent do program impacts differ between freshman students and transfer students? b.Do program impacts differ by other key student demographics? c.To what extent do program impacts differ across sites?
. c.Is 1 st to 2 nd year retention (freshmen) and 3 rd to 4 th year retention (transfers) 20% higher. d.Is the percentage of students graduating within 4 years 20% higher. 2.Within treatment group analyses: a.To what extent do program impacts differ between freshman students and transfer students. b.Do program impacts differ by other key student demographics. c.To what extent do program impacts differ across sites .")
18
KATEWINTEREVALUATION.com Impact Evaluation Indicators IndicatorContrastTimingSource 4 year graduation rate improves by 20% Treatment versus control groups, by cohort and set Annual, once cohorts have progressed through (PY3) Registrar data/ IR 1 st to 2 nd (frosh) and 3 rd to 4 th year retention (tr) improves by 20% Treatment versus control groups, by cohort and set Annual, starting end of PY2 Registrar data/ IR 100% of treatment students complete 30 cr/yr Treatment versus control groups, by cohort and set Annual, starting end of PY2 Registrar data/ IR First year GPA (third year for transfers) improves Treatment versus control groups, by cohort and set Annual, starting end of PY2 Registrar data/ IR
 Registrar data/ IR 1 st to 2 nd (frosh) and 3 rd to 4 th year retention (tr) improves by 20% Treatment versus control groups, by cohort and set Annual, starting end of PY2 Registrar data/ IR 100% of treatment students complete 30 cr/yr Treatment versus control groups, by cohort and set Annual, starting end of PY2 Registrar data/ IR First year GPA (third year for transfers) improves Treatment versus control groups, by cohort and set Annual, starting end of PY2 Registrar data/ IR")
19
KATEWINTEREVALUATION.com Impact Evaluation Indicators (Cont.) IndicatorContrastTimingSource Student self-confidence improves Pre- to post-intervention scores Annual, starting PY2 Student survey Quantity of academic and support services serving high need students increases # of counseling sessions and % of students receiving counseling before and after program Quantity of active learning experiences, research experiences, and co-curricular supports increase # of opportunities and % of students participating before and after program RAM Program model is tested across five partner sites and prepared for further replication N/A
 IndicatorContrastTimingSource Student self-confidence improves Pre- to post-intervention scores Annual, starting PY2 Student survey Quantity of academic and support services serving high need students increases # of counseling sessions and % of students receiving counseling before and after program Quantity of active learning experiences, research experiences, and co-curricular supports increase # of opportunities and % of students participating before and after program RAM Program model is tested across five partner sites and prepared for further replication N/A")
20
KATEWINTEREVALUATION.com Implementation Evaluation Formative and Summative Assessment

21
KATEWINTEREVALUATION.com Implementation Evaluation Questions 1.To what extent are program activities implemented with fidelity and quality (participants, timing, content)? 2.What kinds of experiences will RAM program participants and program staff members have as part of receiving/administering the program? 3.What is the program participants’ perceived level of satisfaction with program services? 4.What are the RAM program strengths and areas for improvement? 5.To what extent does RAM program implementation differ across sites?

22
KATEWINTEREVALUATION.com Implementation Evaluation Indicators (PY1) ActivityOutputTimingSource Offer faculty development for enhanced courses (CL), additional research, and research funding # of faculty ready to support CL # of enhanced courses Network with research opportunities# of on- and off-site research slots available Prepare RAM counseling# of counselors Implement block scheduling# of blocked courses Develop websiteResources shared on website/tracking analytics Randomly select and assign cohort 1First cohort of RCT ready
 ActivityOutputTimingSource Offer faculty development for enhanced courses (CL), additional research, and research funding # of faculty ready to support CL # of enhanced courses Network with research opportunities# of on- and off-site research slots available Prepare RAM counseling# of counselors Implement block scheduling# of blocked courses Develop websiteResources shared on website/tracking analytics Randomly select and assign cohort 1First cohort of RCT ready")
23
KATEWINTEREVALUATION.com Implementation Evaluation Indicators (PYs 2-5) ActivityIndicator/OutcomeTimingSource FYE & SYE/TYE coursesEvidence of experiences, # of students participating, student perceptions Foundational courses have CL# of foundational courses with CL, students in CL courses, student perceptions Special events# of events, students participating, perceptions of usefulness Counseling# of hours of counseling received, % of students meeting reqs., perceptions of Digital Roadmaps Block scheduling# and percentage of courses blocked Research mentors/ opportunities # of students matched, hours of mentoring, research placements (#offsite, #onsite), student presentns/pubs Resource sharing via websiteSite analytics show high rate of resource utilization and engagement, user perceptions Monitoring and assessmentTimely feedback, annual formative reports
 ActivityIndicator/OutcomeTimingSource FYE & SYE/TYE coursesEvidence of experiences, # of students participating, student perceptions Foundational courses have CL# of foundational courses with CL, students in CL courses, student perceptions Special events# of events, students participating, perceptions of usefulness Counseling# of hours of counseling received, % of students meeting reqs., perceptions of Digital Roadmaps Block scheduling# and percentage of courses blocked Research mentors/ opportunities # of students matched, hours of mentoring, research placements (#offsite, #onsite), student presentns/pubs Resource sharing via websiteSite analytics show high rate of resource utilization and engagement, user perceptions Monitoring and assessmentTimely feedback, annual formative reports")
24
KATEWINTEREVALUATION.com Evaluation Timeline Regularly scheduled check-in conference calls Formative assessment after each term Summative assessment after each year Cumulative summative assessment after NCE Y5

25
KATEWINTEREVALUATION.com Questions or Comments? kate@katewinterevaluation.com 703-574-3746

Similar presentations


 Pamela E. Wanga, Ph.D. Associate.>")


>")


 2 : Minority Student Pipeline, Math Science Partnership Strengthening the Early-College Minority Student Pipeline in Science with a Multi-Faceted.>")